Key takeaways
- More than half of new homeowners (53%) assume their property is secure simply because it's newly built, revealing a potentially dangerous gap in home security awareness.
- 39% of new-home residents have made zero home security investments. Among them, 51% say it's because they feel safe enough.
- Over 1 in 5 new home residents (21%) have installed fake security equipment like cameras or signs to make their home look secure.
- Nearly 75% of new construction residents can't identify their neighborhood's crime rate but still feel "very safe."
- Residents of newly built homes were 43% more likely than those living in older homes to report a break-in or attempted break-in.
- 31% of new-home residents delayed security measures because they "felt safe."
- 59% of Baltimore's new home residents reported feeling safer simply because their home is newly built, yet the city's residential burglary rate (850.7 per 100K) is over 6x higher than the national average (130.9).
New construction homes often come with the promise of better design, modern features, and according to many residents, a stronger sense of safety. But do these feelings of security hold up under scrutiny?
To better understand how perceived safety influences behavior, Vivint surveyed over 1,000 residents in major U.S. cities and analyzed FBI burglary data to compare crime trends in new versus older homes. "New homes" refer to houses or apartments constructed within the past five years, while "older homes" include properties built more than five years ago. The results reveal a gap between how safe people feel in new builds and how protected they actually are.

The illusion of safety in new construction homes
Many people trust that a newly built home naturally provides more protection against crime. But that assumption can lead to overlooked vulnerabilities and skipped security upgrades.
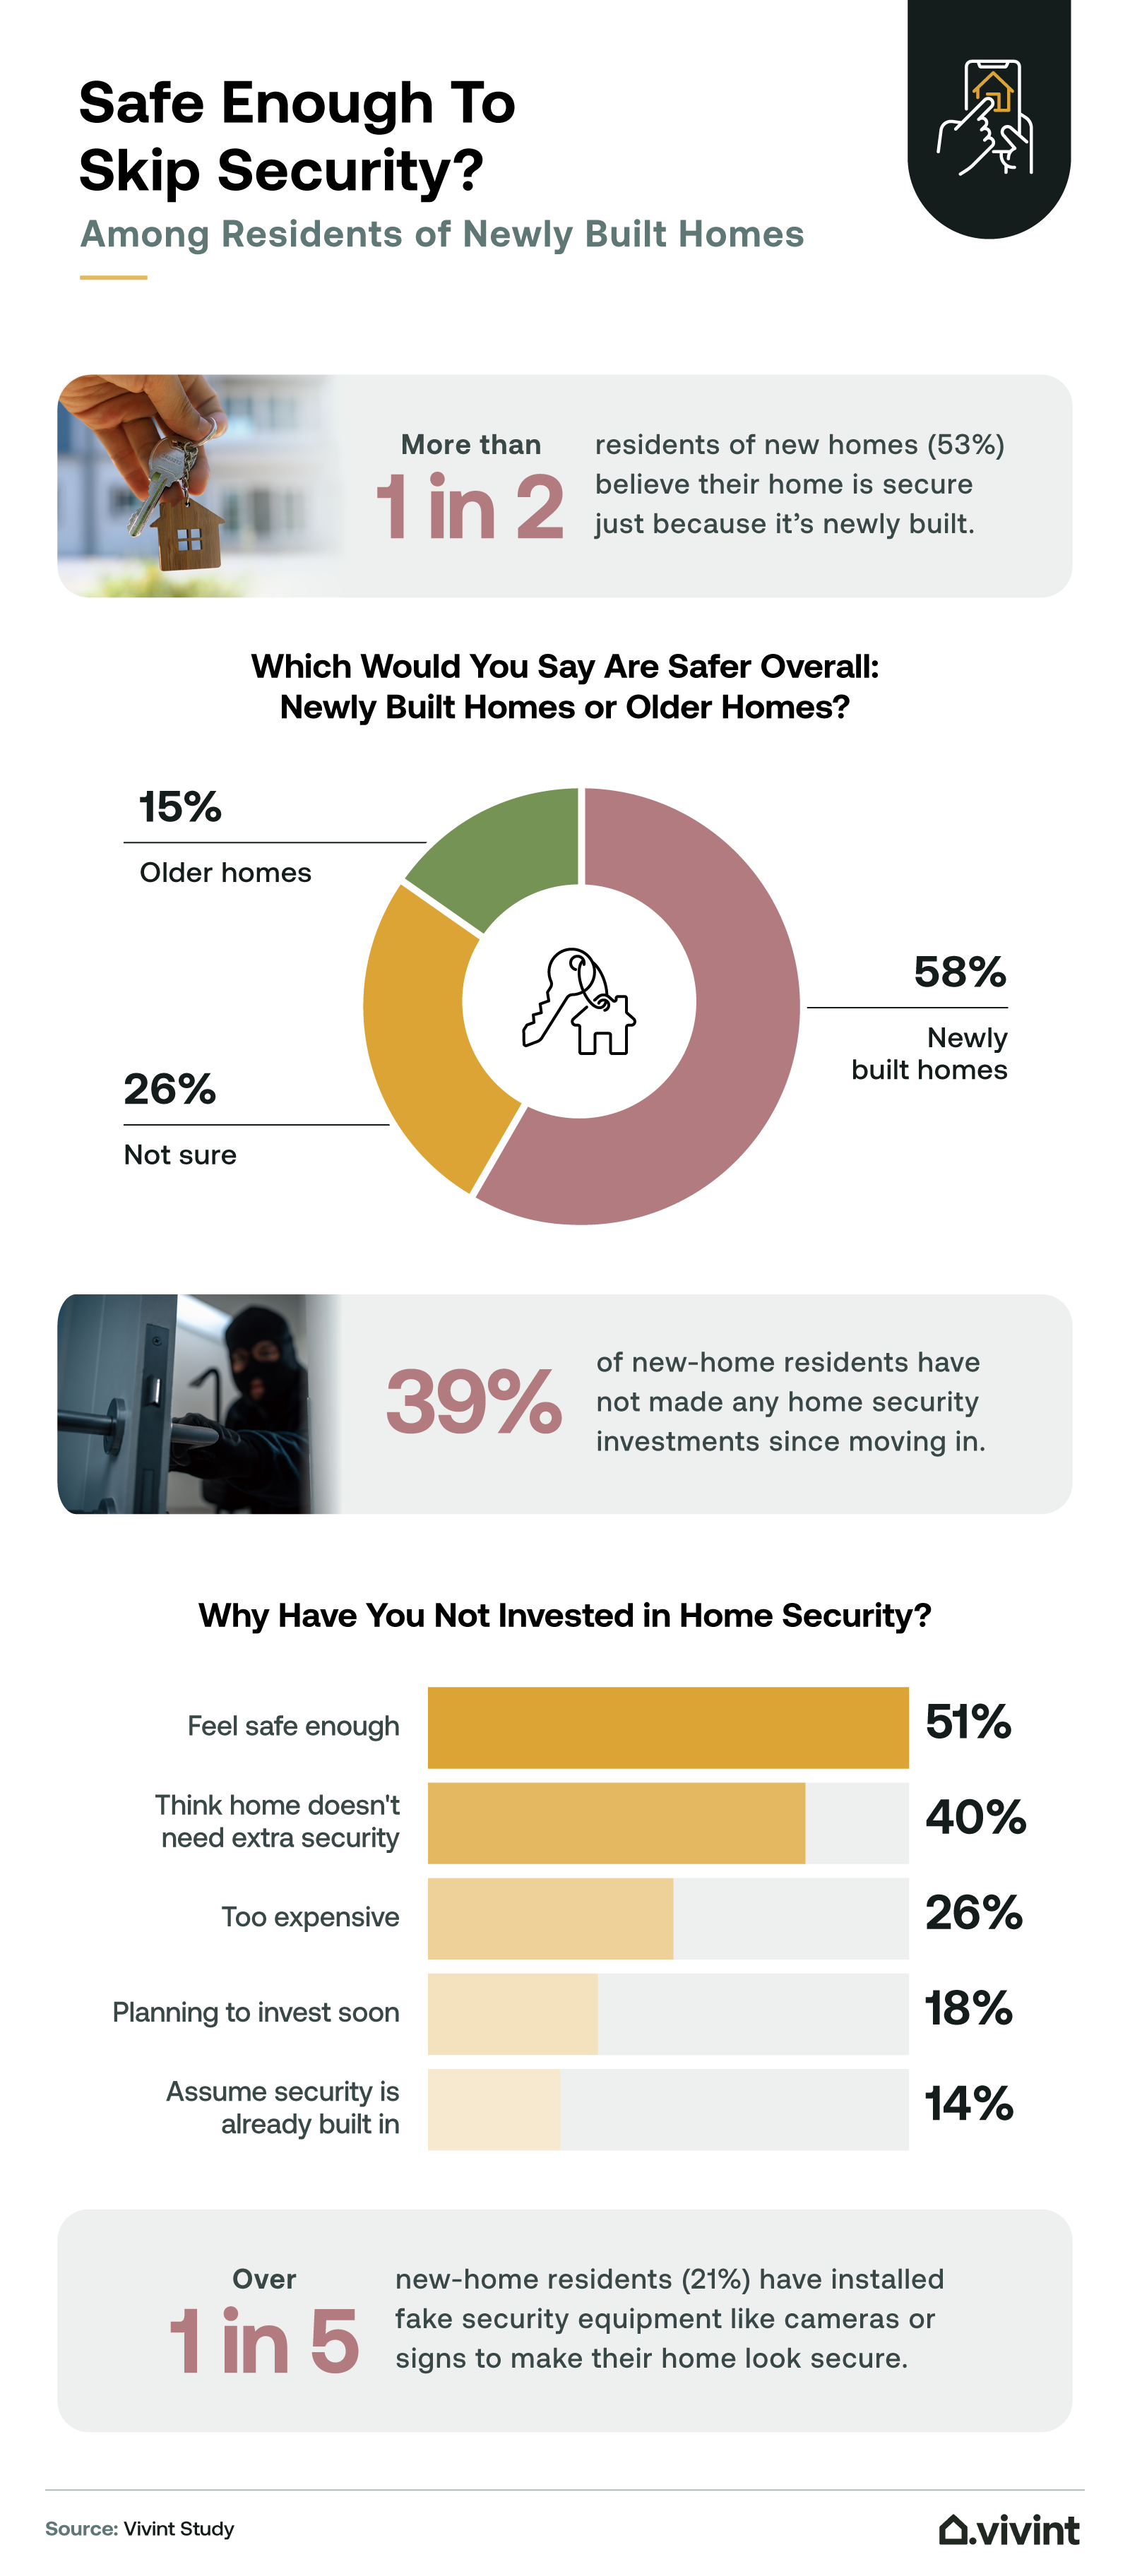
More than half of residents living in new construction homes (53%) believed their property was secure simply because it was new. Gen Z residents were the most likely to assume new equals safer at 59%, followed by millennials (55%) and Gen X (43%). Over half of new-home residents (53%) also said this belief influenced their decision to move into a new home. A third reported that a realtor, landlord, or builder told them that the home was "safer because it's new."
Despite this perceived safety, some residents still invested in added protection. About 2 in 5 new-home residents (61%) took steps to enhance home security. The most common upgrades included video doorbells (71%), security cameras (66%), motion-activated floodlights (32%), smart locks (32%), smart home integration (31%), and window sensors (27%).
However, 39% reported making no security investments at all, most commonly because they already felt safe. Gen Z residents were the least likely to make upgrades, with 48% admitting they hadn't added any security measures since moving in. Some residents (21%) opted for a false sense of deterrence instead and installed fake security equipment like cameras or warning signs to give the impression that their home was protected.
Crime rates? No clue, but still feeling safe
Many residents of newly built homes feel secure in their surroundings, but that confidence often isn't based on local crime awareness. This section examines the disconnect between perceived safety and actual risk.
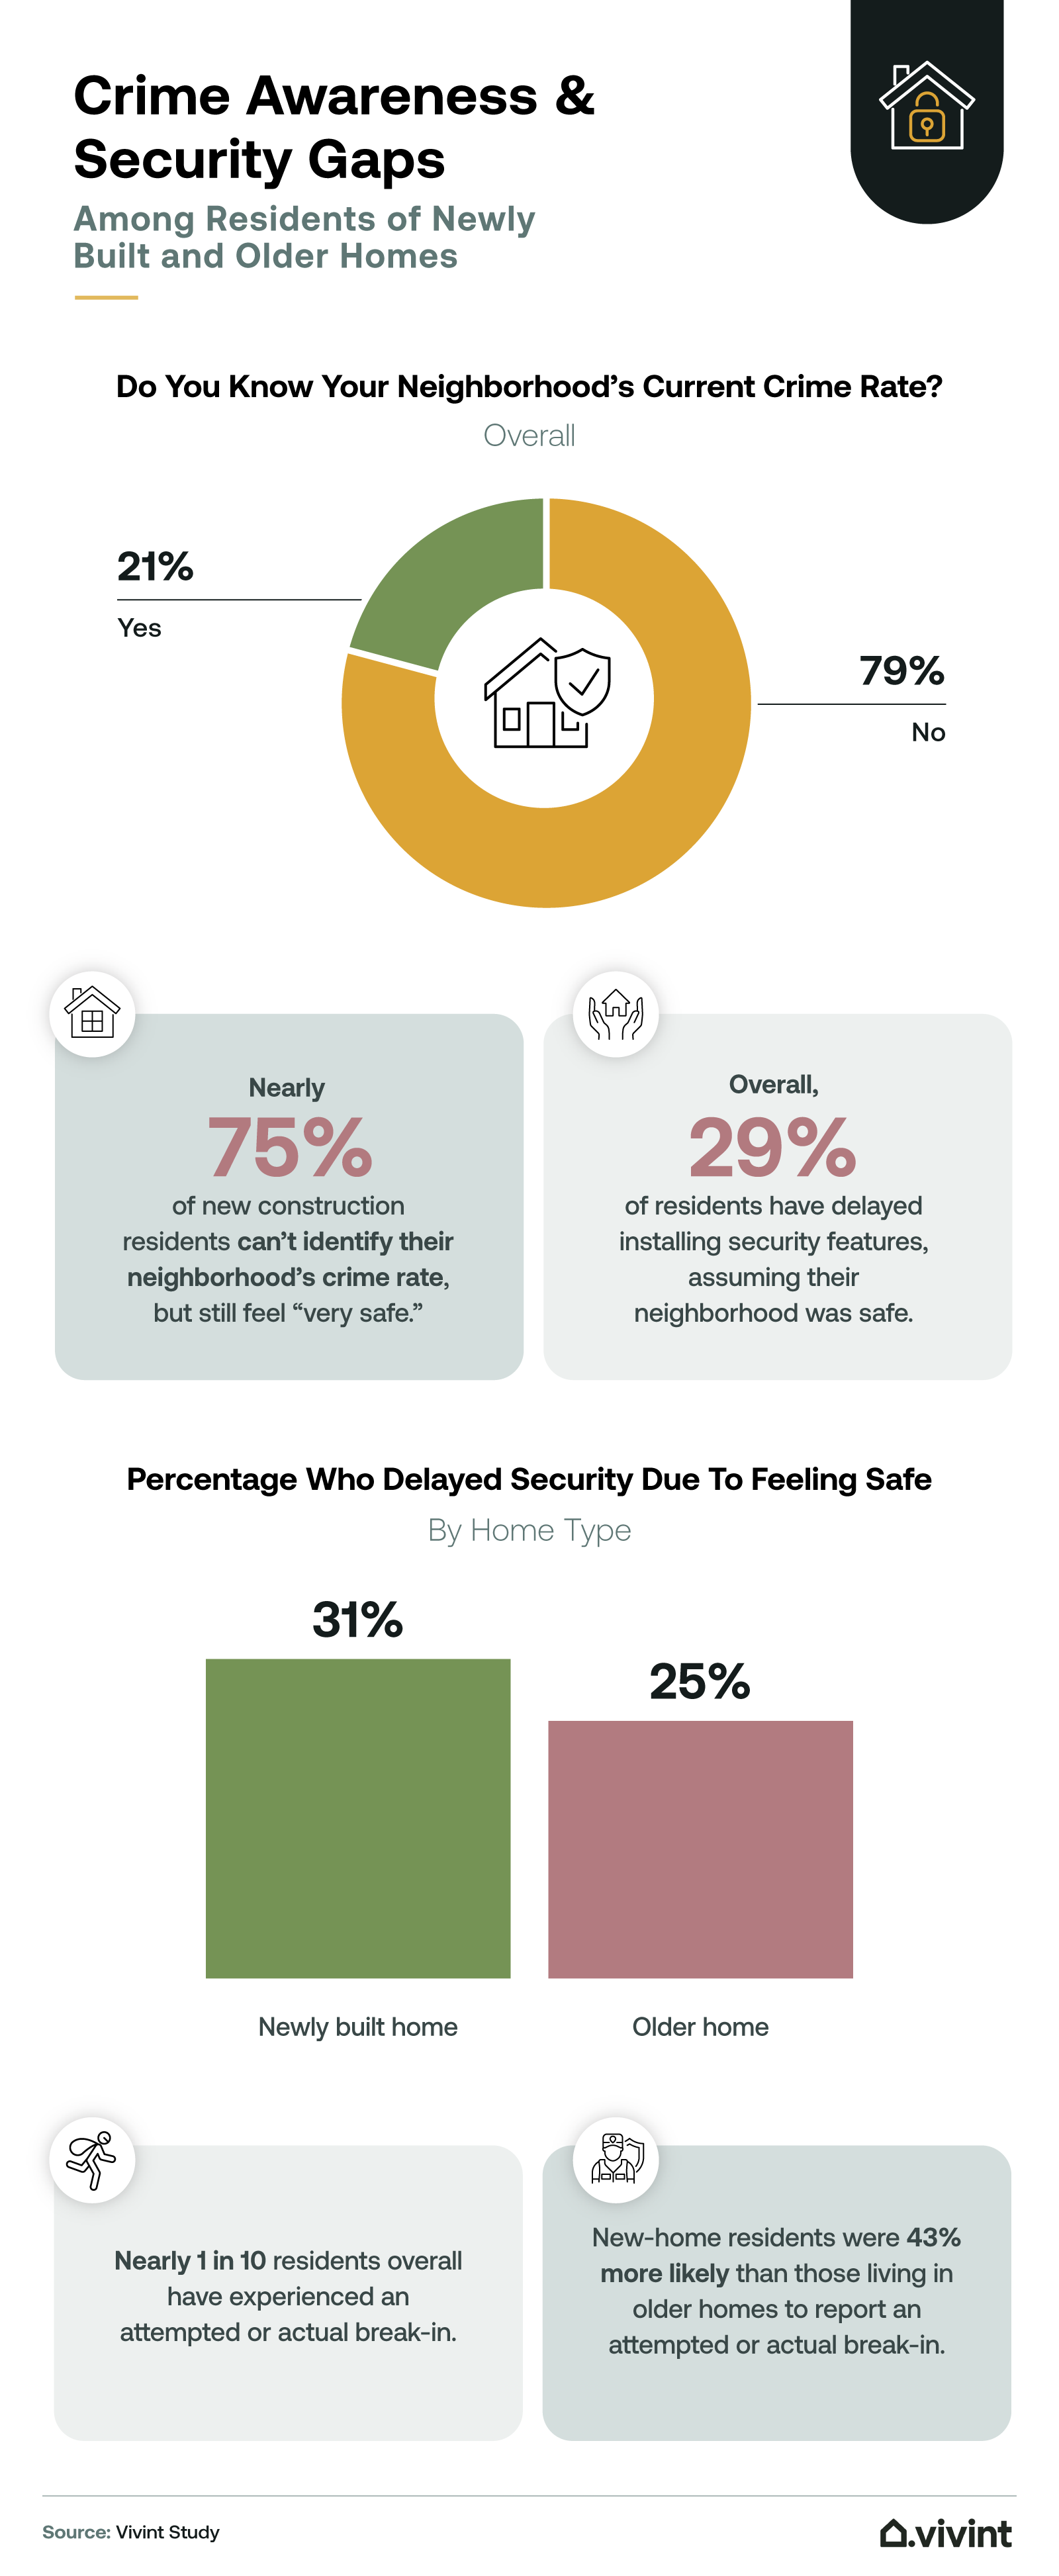
Nearly three-quarters of residents in new construction homes said they couldn't identify their neighborhood's crime rate. Still, the majority described feeling "very safe," which may explain why 31% delayed installing security features simply because they believed there was no immediate need.
That assumption may be risky, as residents of newly built homes were 43% more likely to report a break-in or attempted break-in compared to those in older homes. Surprisingly, only 14% of all respondents believed break-ins were more likely in newer homes. A larger share (18%) thought older homes were more vulnerable, while 68% said the risk was about the same in either home.
Cities where new-home confidence clashes with reality
Some U.S. cities show a sharp contrast between how safe new-home residents feel and how often break-ins actually occur.
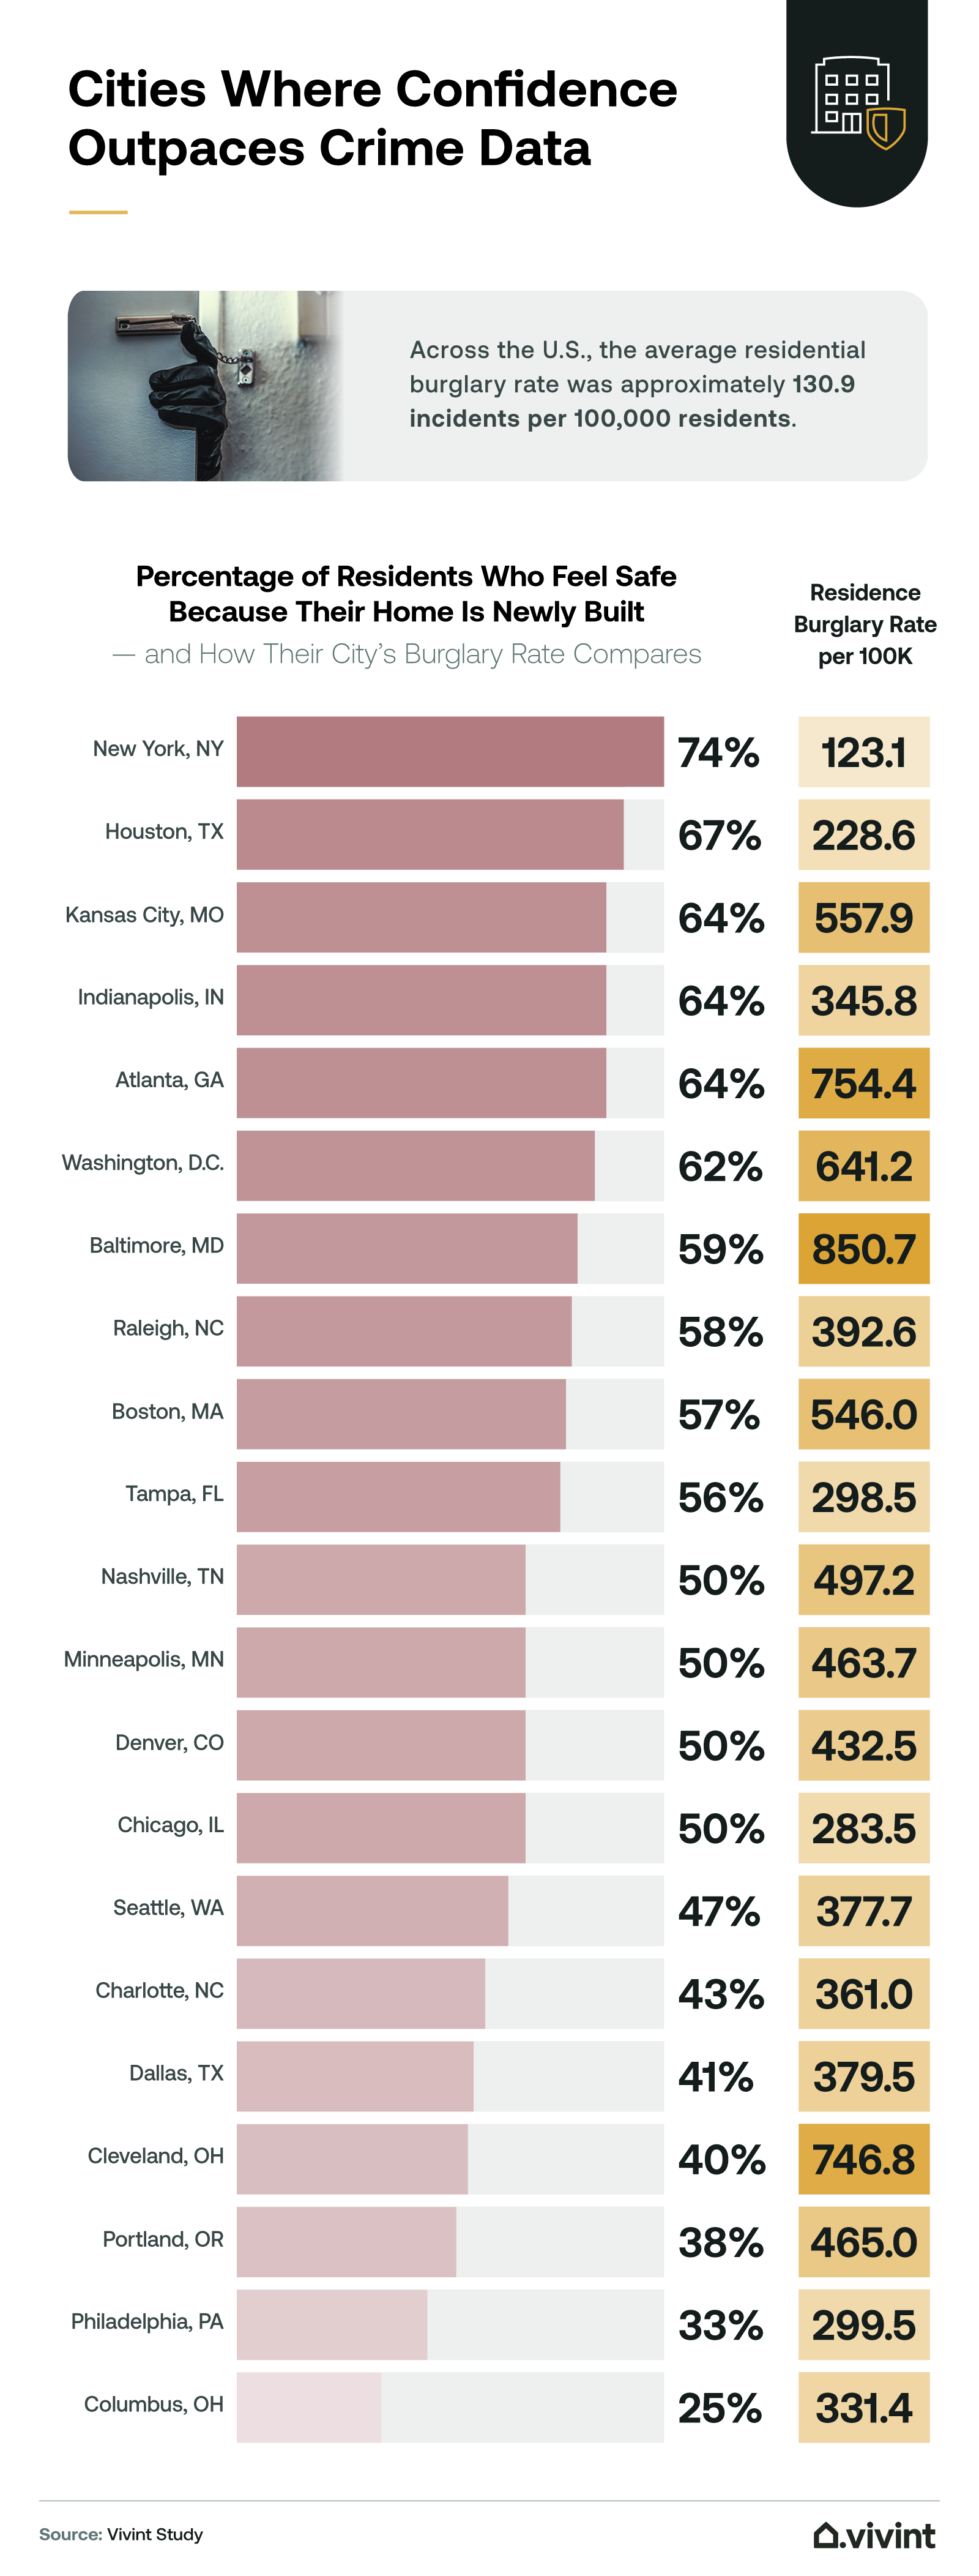
In Atlanta, 64% of new construction residents said they felt safer simply because of their home's age. But that confidence doesn't align with the data. Residential burglaries occurred at a rate of 754.4 per 100,000 residents, making it one of the highest rates in the country. Kansas City and Indianapolis showed similar patterns: 64% of residents in both cities reported feeling secure in new homes, even though burglary rates in each city exceeded 340 per 100,000 residents.
Baltimore also stood out, with 59% of new home residents expressing the same sense of security despite the city having a residential burglary rate of 850.7 per 100,000, more than six times the national average of 130.9. These findings highlight the risk of assuming new construction equals better safety, especially in cities where break-ins remain a frequent threat.
Cities with the highest burglary rates
-
Providence, RI
- 1,326.3 per 100K
- 2,514.1 avg. annual residential burglaries
-
Salt Lake City, UT
- 1,292.3 per 100K
- 2,674.4 avg. annual residential burglaries
-
Honolulu, HI
- 921.1 per 100K
- 3,182.4 avg. annual residential burglaries
-
Riverside-San Bernardino, CA
- 889.0 per 100K
- 2,840.5 avg. annual residential burglaries
-
St. Louis, MO
- 853.0 per 100K
- 2,491.2 avg. annual residential burglaries
-
Richmond, VA
- 850.9 per 100K
- 1,928.3 avg. annual residential burglaries
-
Baltimore, MD
- 850.7 per 100K
- 4,904.1 avg. annual residential burglaries
-
Cincinnati, OH
- 807.3 per 100K
- 2,491.7 avg. annual residential burglaries
-
Detroit, MI
- 801.4 per 100K
- 5,059.5 avg. annual residential burglaries
-
Atlanta, GA
- 754.4 per 100K
- 3,824.6 avg. annual residential burglaries
Cities with the lowest burglary rates
-
El Paso, TX
- 96.7 per 100K
- 655.2 avg. annual residential burglaries
-
New York City, NY
- 123.1 per 100K
- 10,259.5 avg. annual residential burglaries
-
Fort Worth, TX
- 224.4 per 100K
- 2,146.7 avg. annual residential burglaries
-
Houston, TX
- 228.6 per 100K
- 5,264.8 avg. annual residential burglaries
-
San Diego, CA
- 238.3 per 100K
- 3,291.2 avg. annual residential burglaries
-
San Antonio, TX
- 240.0 per 100K
- 3,534.4 avg. annual residential burglaries
-
Chicago, IL
- 283.5 per 100K
- 7,556.1 avg. annual residential burglaries
-
Tampa, FL
- 298.5 per 100K
- 1,235.2 avg. annual residential burglaries
-
Philadelphia, PA
- 299.5 per 100K
- 4,693.9 avg. annual residential burglaries
-
Austin, TX
- 323.8 per 100K
- 3,155.7 avg. annual residential burglaries
Feeling safe isn't the same as being safe
Many residents of new homes trust the age of their property as a sign of better security, but the numbers tell a different story. With new home residents more likely to report break-ins and delay safety upgrades, the assumption that "new equals safe" may be leading to real vulnerabilities. In cities with high burglary rates, this blind spot becomes even more risky. Ultimately, feeling secure shouldn't depend on the year your home was built—it should come from real awareness and proactive safety choices.