
The New-Build Blind Spot: Are Newer Homes Actually Safer From Break-Ins?

Key takeaways

  • Cities with the newest housing stock average 2.5 times fewer burglaries than cities dominated by historic homes.
  • Frisco, TX, has one of the newest housing stocks and one of the lowest burglary rates (fewer than 6 per 100,000 residents).
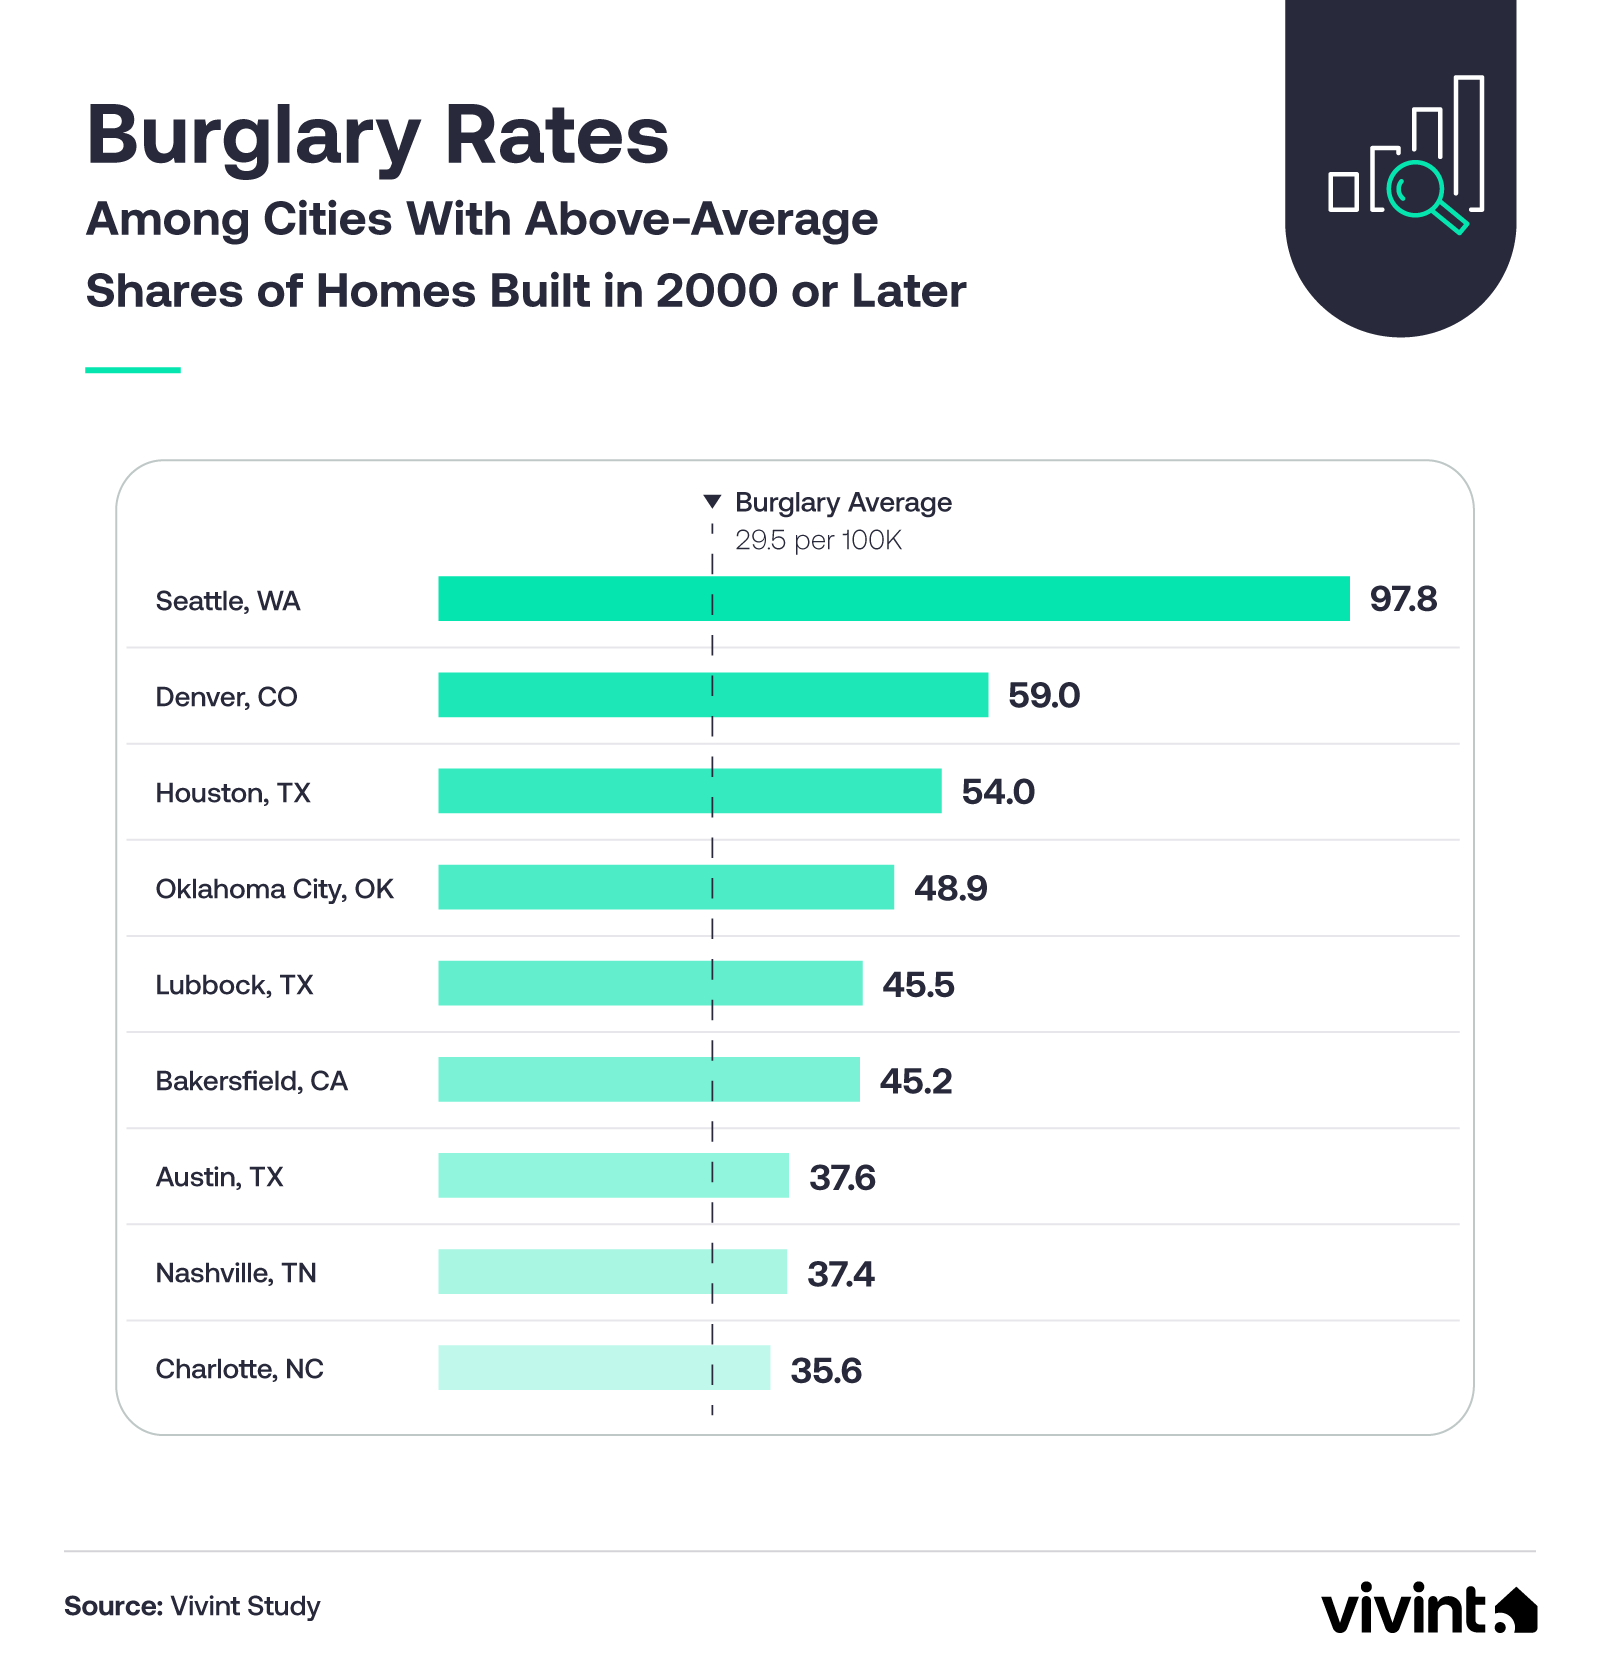
  • New construction doesn't guarantee safety: Seattle, Denver, and Houston all have above-average shares of new housing and above-average burglary rates.
  • Seattle recorded 97.8 burglaries per 100,000 residents despite 37.5% of homes being newer construction (more than 3x the average).
  • Burglary rates climb with home age: 14.8 per 100,000 residents in the newest cities, rising steadily to 36.6 in historic ones.
  • Every city where more than half the homes were built after the year 2000 fell below the burglary average.
New build home's exterior at night.
 

When shopping for a home, buyers often assume that newer construction means better security, modern deadbolts, reinforced frames, and smart home-ready wiring built right in. This analysis cross-referenced 2024 FBI Uniform Crime Reporting burglary data for 177 of the largest U.S. cities with U.S. Census Bureau American Community Survey data on housing stock age to test that assumption. In some cases, housing age does relate to burglary risk, but construction year alone doesn't tell the whole story of how safe a home actually is.

Newer homes, fewer break-ins, but only to a point

The data shows a clear pattern across U.S. cities: the newer the housing stock, the lower the average burglary rate. But as cities with high shares of new construction and stubbornly high crime rates demonstrate, the age of construction is only part of the equation.

Information about burglary rates in new construction areas.
 

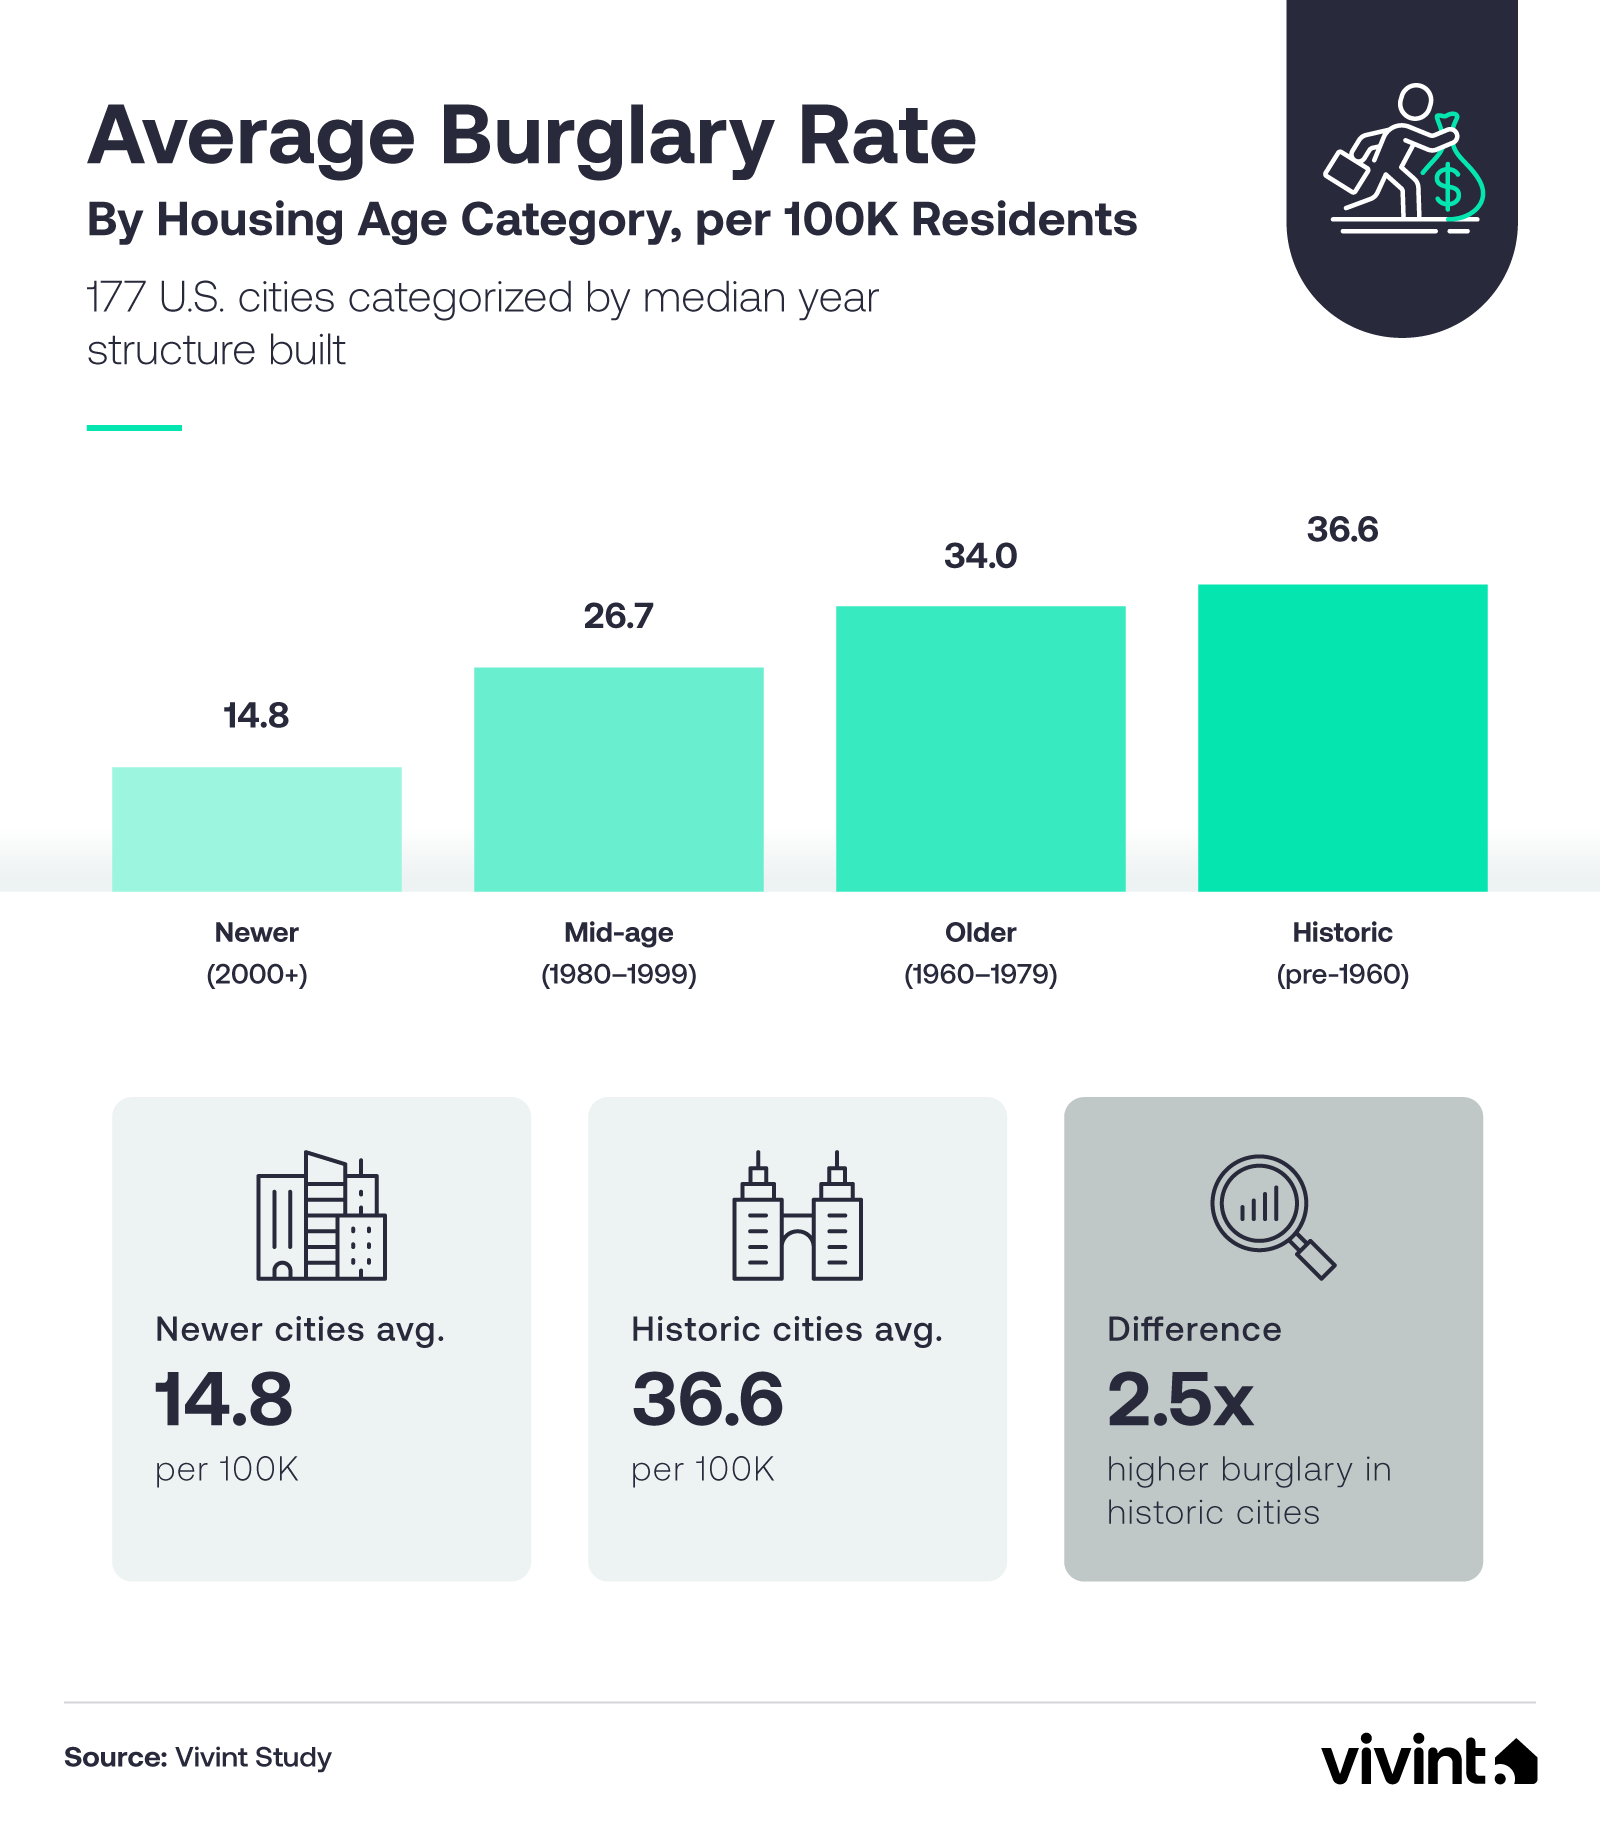
Cities where the median home was built in 2000 or later averaged 14.8 burglaries per 100,000 residents. That's less than half the rate seen in historic cities, where the median home predates 1960, and the average climbed to 36.6 per 100,000 residents.

Burglary rates climbed steadily across all four housing age categories:

  • 14.8 in newer cities (with the most new homes built in or after the year 2000)
  • 26.7 in mid-age cities (homes built between 1980 and 1999)
  • 34.0 in older cities (homes built between 1960 and 1979)
  • 36.6 in historic cities (pre-1960 homes)

Historic cities experienced burglary rates 2.5 times higher than their newer counterparts.

See where your city falls

To see how individual cities fit the pattern, we plotted all 177 cities by their share of homes built after 2000 and their average burglary rate, and then split the results into four groups based on the averages, revealing which cities are:

  • New and safe
  • New but risky
  • Old but safe
  • Old but risky

Some of the most striking exceptions involve cities that have grown rapidly in recent decades.

A negative correlation (-0.32) confirmed that cities with more post-2000 housing tend toward lower burglary rates. Cities like Frisco, TX, with 82% of homes built after 2000 and a burglary rate of just 5.8 per 100,000 residents, and McKinney, TX, with 74% post-2000 construction and a rate of 7.2 per 100,000, sit firmly in the new-and-safe category.

Every city where more than half of homes were built after 2000 fell below the average burglary rate, pointing to a meaningful protective pattern among cities dominated by newer construction.

Seattle, however, recorded the highest burglary rate at 97.8 per 100,000 residents (more than three times the average), despite 37.5% of its housing stock being post-2000 construction. This makes it clear that the year a home was built doesn't always determine its security.

The cities that prove new construction alone isn't a security strategy

Among the 177 cities analyzed, those with above-average shares of post-2000 housing (27.8% or more) and above-average burglary rates (29.5 or more per 100,000 residents) show where new construction has done the least to close the security gap.

Information about burglary rates in new construction homes.
 

Seattle led with 97.8 burglaries per 100,000 residents (more than three times the average), despite 37.5% of its homes being built after 2000. Denver, Houston, and Oklahoma City similarly combined above-average new construction shares with well-above-average burglary rates. Austin, Nashville, and Charlotte, three cities that have experienced some of the most significant population and housing growth in the country, all recorded above-average burglary rates despite high shares of new construction.

What these cities share is rapid growth, urban density, and the kinds of environmental factors that no building code addresses. A newer home may come with better locks and a more reinforced frame, but it doesn't always come with a monitored alarm, a video doorbell, or smart sensors that can detect a break-in in real time.

What the data can't measure, and why it matters

Housing age captures only what was built into a home, not what has been added since. The cities that defy the new-construction-means-safety assumption are a reminder that a build date is not a measure of security.

For homeowners in newer cities with high burglary rates, and for anyone in a mid-age, older, or historic home, the data points to the same conclusion: the year your home was built is not the same as the strength of your home's protection. Active security measures fill the gap that construction standards leave open, regardless of whether your home is brand new or a century old.

Methodology

Burglary rates were sourced from the FBI Crime Data Explorer using full-year 2024 agency-level offense data submitted under the National Incident-Based Reporting System (NIBRS). Only cities whose police departments submitted complete 12-month reporting for 2024 were included; cities with missing months, unavailable data, or apparent reporting anomalies were excluded from analysis. Housing age data were drawn from the U.S. Census Bureau American Community Survey (ACS) 5-year estimates (2020–2024), specifically table B25034 (year structure built) and table B25035 (median year structure built), at the place geography level.

The analysis was conducted across 177 U.S. cities among the largest by population for which complete data were available from both sources. Cities were categorized into four housing age groups based on median year structure built: Newer (2000 or later, n=14), Mid-age (1980–1999, n=82), Older (1960–1979, n=55), and Historic (pre-1960, n=26). Average burglary rates were calculated for each group. A Pearson correlation coefficient was computed between each city's share of post-2000 housing units and its 2024 burglary rate.

All burglary rates are expressed per 100,000 residents using population figures consistent with each agency's reporting. For the scatter plot, results were visualized by plotting each city's share of post-2000 housing units on the x-axis against its 2024 burglary rate on the y-axis; reference lines were drawn at the dataset averages for each variable to identify cities falling above or below average on both measures.

This analysis reflects city-level aggregate patterns and does not make claims about individual homes or households. Housing age is used as a proxy for construction era and associated building standards; it does not capture security system adoption, renovation history, or other factors that may affect a home's actual security profile.

Fair use statement

The data and findings in this article may be used for noncommercial purposes only. If republished or referenced, please include a link to this page attributing the original research to Vivint.

Get a free quote today.

A Vivint Smart Home Pro will contact you within 24 hours. Or skip the form and call now: 844.481.8630.

By clicking "Start Your Quote", you agree by electronic signature to:
1. The Electronic Disclosure Consent;
2. Receive recurring marketing communications from Vivint at the telephone number and email address you provide on this form, including autodialed calls, texts and prerecorded, artificial, or AI voice messages (consent not required to make a purchase; reply “STOP” to opt-out of texts or “HELP” for help); and
3. Vivint's Terms of Service and Privacy Policy.

Related content
  • Best Smart Home Security Systems

    Protect Your Home with Vivint's Home Security Systems & Burglar Alarm - Call 855.677.2644 for More Information about our Award Winning 24 7 Home Security Services.

  • Security Camera Systems

    Vivint's Home Security Cameras System allows you to keep an eye on your home via Indoor Security Camera & Outdoor Security Cameras all Accessible through Vivint’s App. Call 855-743-7375 to ...

  • Home Automation Services for Smarter Living

    Control Security Equipment & Smart Home Devices with a Vivint Home Automation System. Call 855.747.4838 for More Information about our Award Winning 24/7 Smart Home Automation Systems.

*Offer Terms & Conditions

All offers are subject to availability and may not be available in all states, provinces, or zip codes. Taxes and additional fees may apply.

HomeProtect Offer Terms

Vivint’s standard HomeProtect package includes 1 Vivint Security Hub, 3 Vivint Door & Window Sensors, 1 Vivint Motion Sensor, 1 Vivint Keypad, and 1 Vivint yard sign. The HomeProtect equipment package is regularly priced at $349.99, with professional installation priced at $199 and Vivint system monitoring at $29.99/mo., unless otherwise advertised. Offer for new Vivint customers only.

HomeProtect Pro Offer Terms

The HomeProtect Pro Offer is available to new and existing Vivint customers and requires a minimum $749.99 expenditure on equipment (after discounts), professional installation and execution of a Vivint services agreement. Monthly service fees vary based on the products and services you select. HomeProtect system purchases and reactivations of previously-installed systems are not eligible for this offer.

Financing Options

Financing for equipment purchases is subject to credit approval by one of Vivint’s third-party financing partners. Qualified customers may finance at 0% APR for up to 60 months, with terms varying by offer. Financing requires a separate agreement with the financing partner. Month-to-month service agreements are available when equipment is purchased upfront.

Vivint Systems & Services

System can support multiple cameras, subject to sufficient WiFi speeds. Without a Vivint services plan, product and system functionality is limited (including loss of remote connectivity). Contact a Vivint representative for complete equipment, services, and pricing details. Products and services in Louisiana provided by Vivint Louisiana Commercial Certificate #58280. See Vivint license numbers here. Click here for full terms of service.