
Traditional security cameras only notify and record—but Vivint does more. Discover how Vivint Smart Deter ™ uses AI to actively prevent crime instead of just recording it.
The Neighborhood Name Safety Index
The names attached to neighborhoods do a lot of quiet work. Lake, Park, Heights, Gardens—they suggest greenery, calm, and a certain kind of life. Real estate marketing leans on these names constantly, and so do homebuyers when they're scanning listings or driving through unfamiliar parts of a city. But how often do those names line up with what's actually happening on the streets?
To find out, Vivint analyzed roughly 1.88 million property crime incidents reported across 18 U.S. metros from 2023 through 2024, mapped each incident to the named neighborhood where it occurred, and compared crime rates across the 10 most common aspirational name types. The result is a look at which names deliver on the safety they imply, which break the perception halo, and which premium-priced neighborhoods don't quite match their brochure.
Key takeaways
- Lake-named neighborhoods see 44% fewer vehicle break-ins, 38% less theft, and 36% fewer home break-ins than their metro averages, making "Lake" the safest "aspirational" name in the country with 40% less property crime overall.
- "Square"-named neighborhoods see 112% more property crime than their metro average, the only "aspirational" name in the study that correlates with significantly higher crime.
- Three of the country's most famous "Square" neighborhoods are also the most extreme outliers in the study: Times Square (+1,123%), Union Square (+683%), and Hudson Square (+493%) all sit at the top of NYC's property-crime distribution, anchoring the broader "Square" finding.
- Three names earn a statistically significant safety advantage on every kind of property crime tested: Lake, Heights, and Park. Hills is close behind, with significant dividends on theft and vehicle break-ins.
- Le Droit Park in Washington, DC, sees 219% more property crime than the DC average, and theft alone runs 269% higher, despite home values in the 78th percentile of the metro.

Which neighborhood names actually keep their promise
For each of the 10 most common aspirational name types, Vivint compared property crime rates in those neighborhoods against the average for their metro. The differences fell into a clear hierarchy, with one name standing alone as an outlier in the wrong direction.
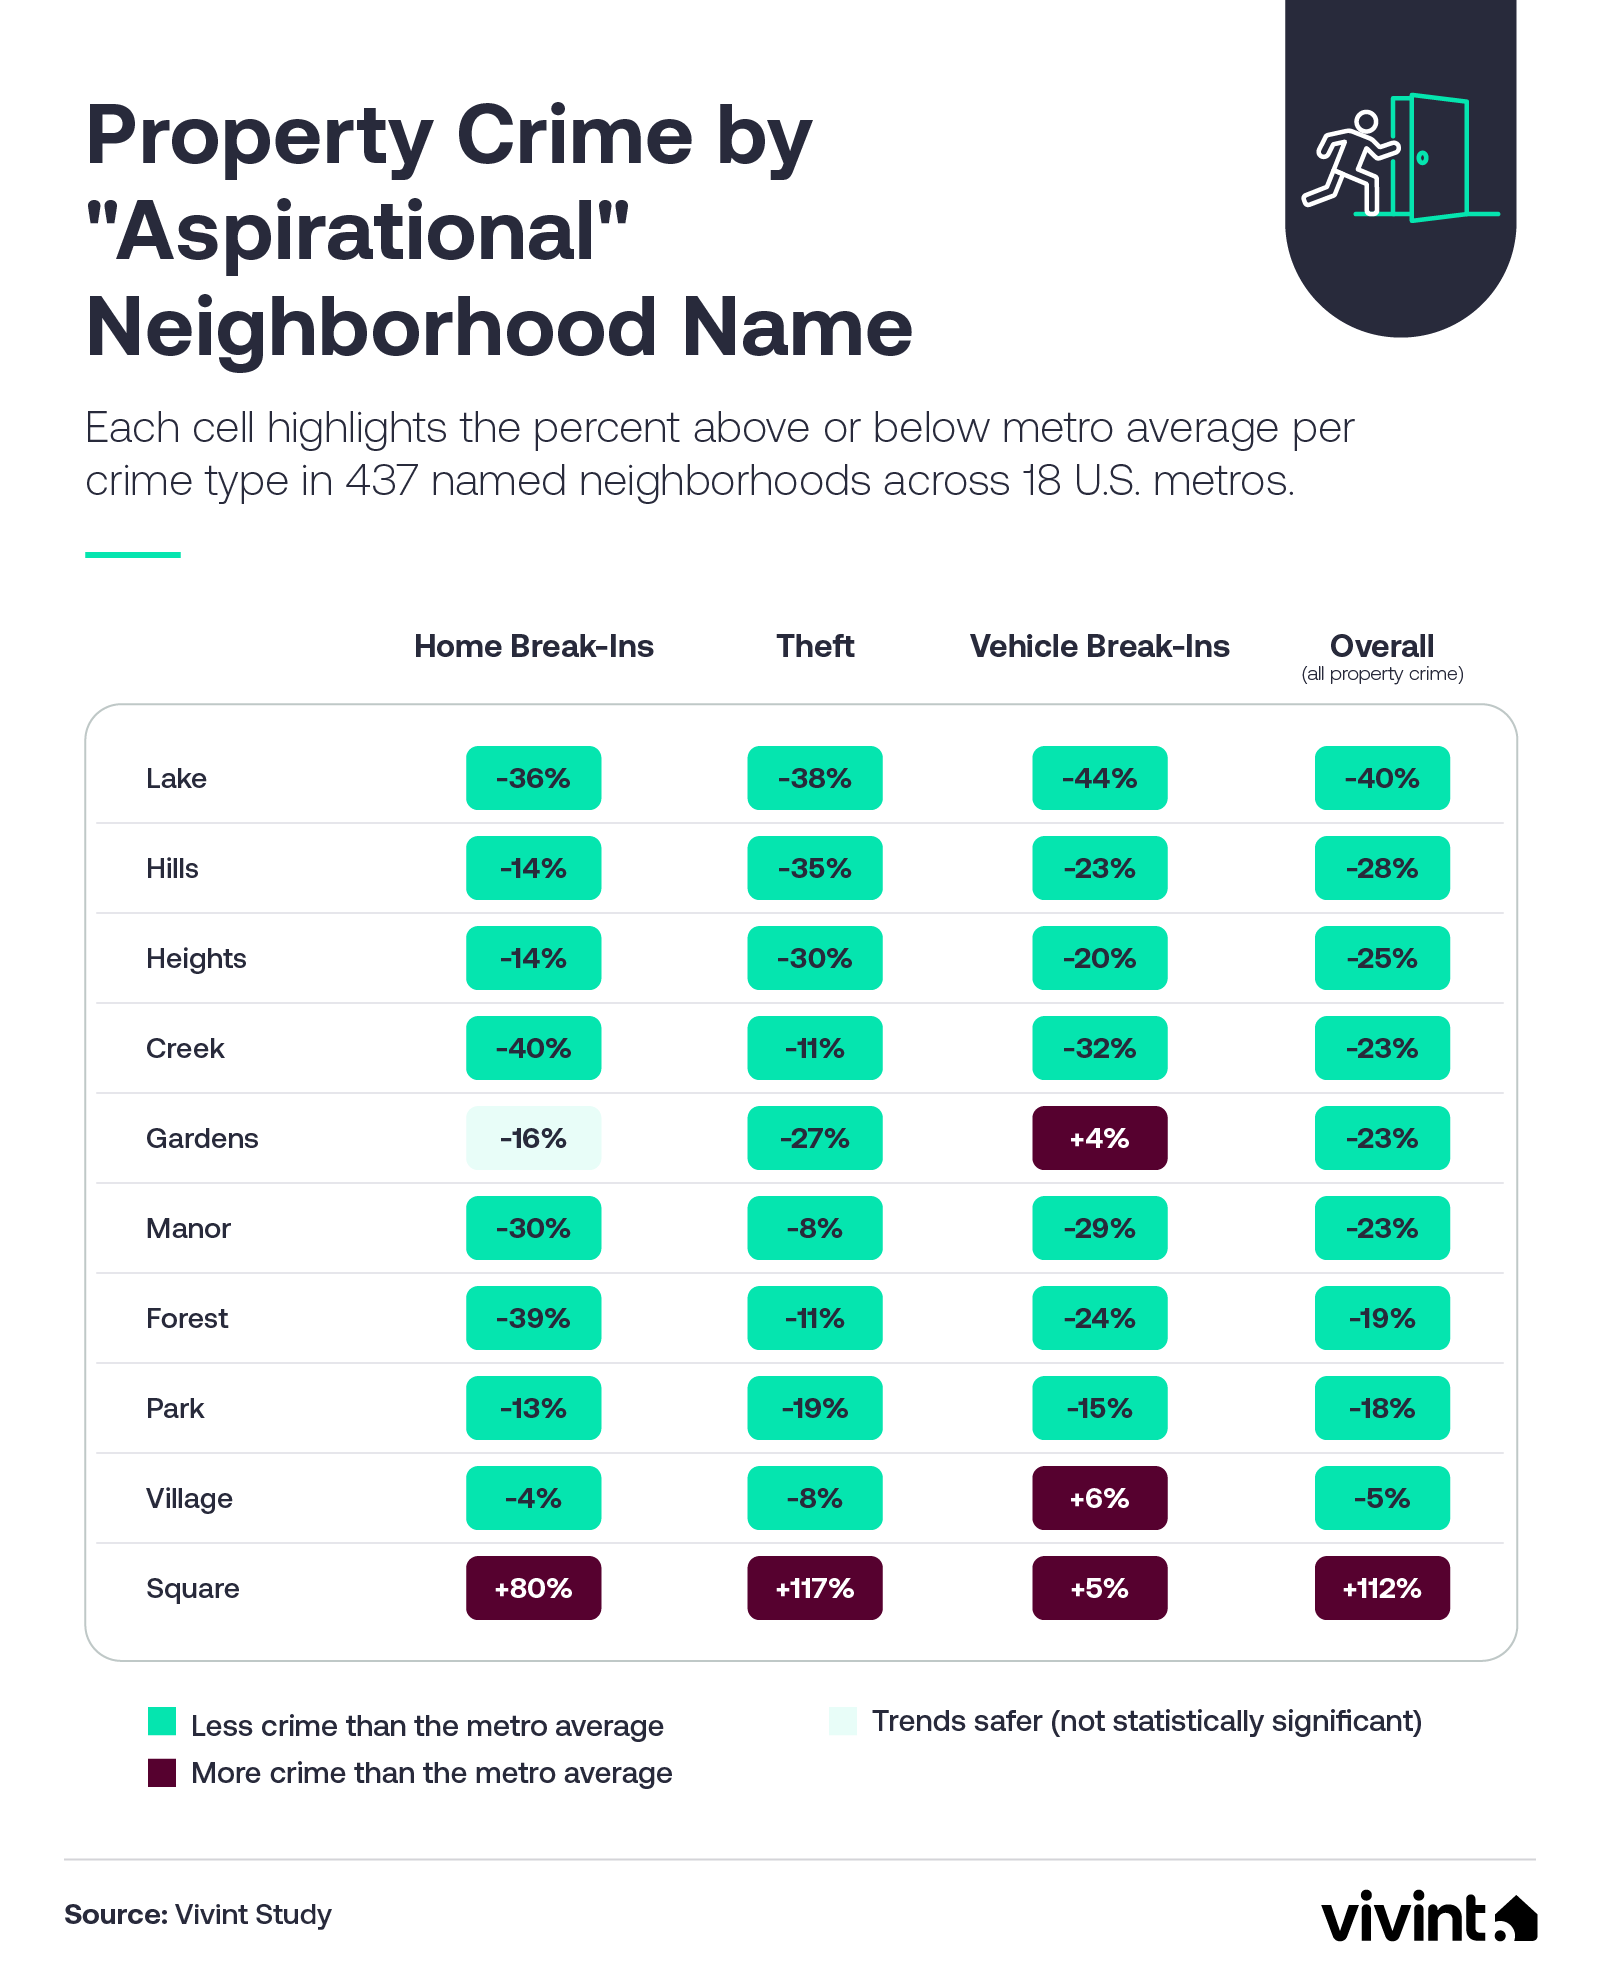
Lake-named neighborhoods landed at the top, with property crime running 40% below their metro averages. The dividend held across every category tracked, with home break-ins down 36%, theft down 38%, and vehicle break-ins down 44%. No other name produced a stronger overall result.
The full ranking, by overall property crime versus the metro average:
- Lake. 40% below the metro average, with home break-ins down 36%, theft down 38%, and vehicle break-ins down 44%. All three are statistically significant, and Lake produces the strongest pattern in the study.
- Hills. 28% below the metro average, with theft down 35% and vehicle break-ins down 23%, both statistically significant. Home break-ins trend 14% safer but don't quite reach significance.
- Heights. 25% below the metro average, with home break-ins down 14%, theft down 30%, and vehicle break-ins down 20%. All three are statistically significant.
- Creek. 23% below the metro average, with home break-ins down 40% (statistically significant). Theft and vehicle break-ins trend safer but don't reach significance.
- Gardens. 23% below the metro average, with theft down 27% (statistically significant). Home break-ins trend 16% safer (not significant), and vehicle break-ins trend 4% higher (also not significant).
- Manor. 23% below the metro average, with home break-ins down 30% and vehicle break-ins down 29%, both statistically significant. Theft trends 8% safer but doesn't reach significance.
- Forest. 19% below the metro average, with home break-ins down 39% and vehicle break-ins down 24%, both statistically significant. Theft trends 11% safer but doesn't reach significance.
- Park. 18% below the metro average, with home break-ins down 13%, theft down 19%, and vehicle break-ins down 15%. All three are statistically significant, and Park is the most common aspirational name in the country.
- Village. 5% below the metro average overall, but with no statistically significant safety advantage on any individual crime type. Home break-ins trend 4% safer, theft trends 8% safer, and vehicle break-ins trend 6% higher.
- Square. 112% above the metro average, with 80% more home break-ins (statistically significant) and 117% more theft. The only aspirational name with significantly more crime than its metro.
The single-category leaders break out to a tight cluster of names:
- Strongest home break-in dividend. Creek leads, with burglary 40% below the metro average.
- Strongest theft dividend. Lake leads, with theft 38% below the metro average.
- Strongest vehicle break-in dividend. Lake again, with vehicle break-ins 44% below the metro average.
The headline numbers don't tell the full story, though. To see which names deliver across the full range of property crimes, the analysis tested each name's performance separately on home break-ins, theft, and vehicle break-ins, with a finding flagged as significant only when both sample size and statistical confidence cleared established thresholds. Sorted by how many of the three crime types saw a real safety dividend:
- Three for three. Lake, Heights, and Park each posted significant safety advantages across every crime type.
- Two for three. Hills, Manor, and Forest delivered significant advantages on two of the three.
- One for three. Creek and Gardens cleared the bar on one.
- No measurable advantage. Village earned no statistically significant edge on any crime type.
- Significantly worse. Square posted significantly more home break-ins than its metro average.
Hills came especially close to clearing the top bar, with significant dividends on theft and vehicle break-ins and a 14% trend toward fewer home break-ins that fell just shy of statistical significance. On the opposite end, Square saw 80% more home break-ins, 117% more theft, and 112% more overall property crime than its metro average. It's the only aspirational name in the study that correlated with significantly higher crime, and the gap is anchored by some of the most famous addresses in the country.
When the perception halo breaks
Of the 437 named neighborhoods in the dataset, 233 are priced above their metro's median home value. These are neighborhoods where the name, the price tag, and the marketing all point toward a premium experience. But premium pricing doesn't always come with premium safety.
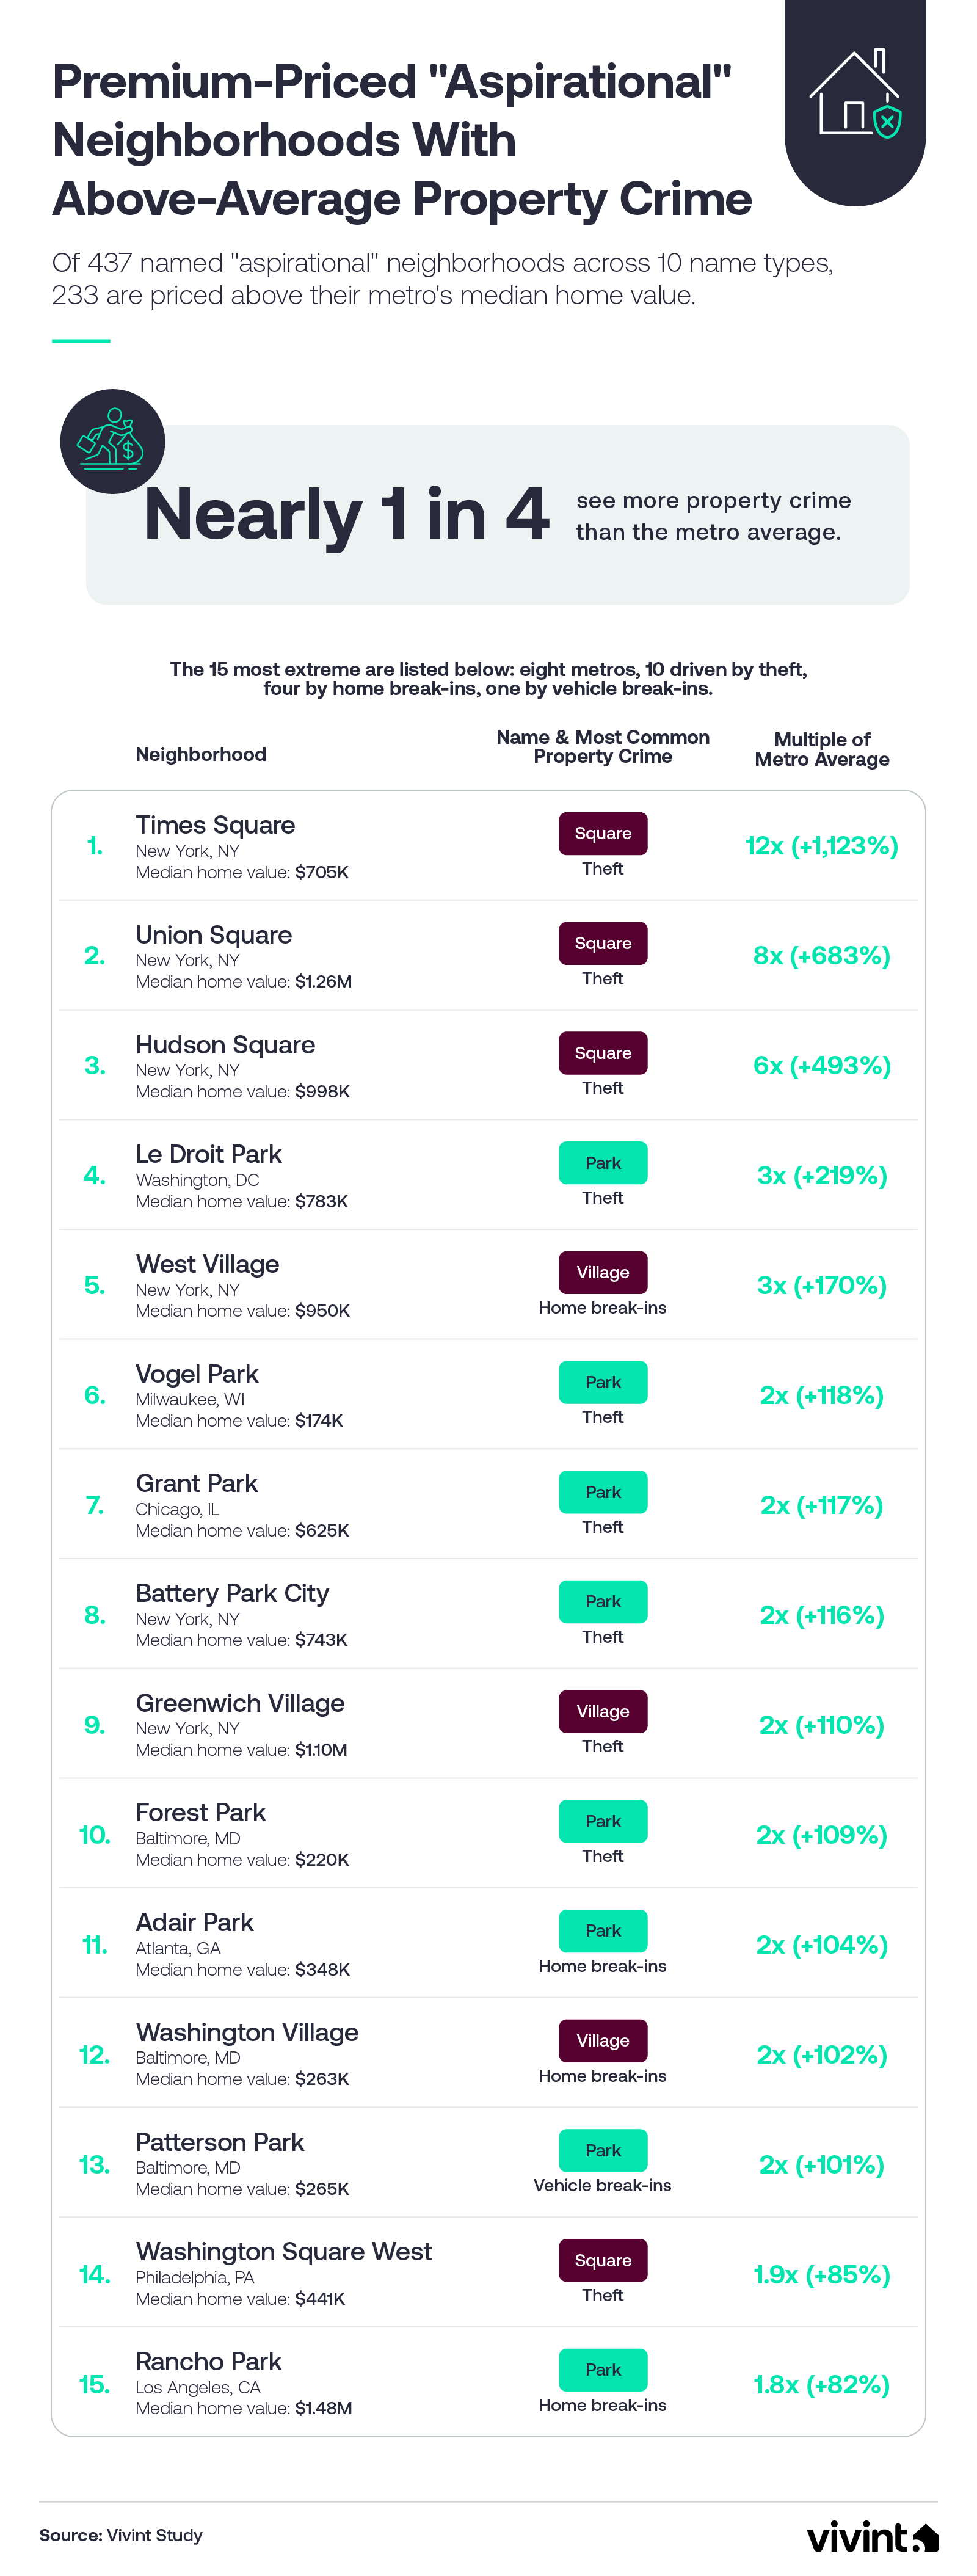
Of those 233 premium-priced neighborhoods, 54 (nearly 1 in 4) actually see more property crime than their metro average. The 15 most extreme exceptions run between 82% and 1,123% above their metro averages, clustering in just eight metros.
The 15 most extreme premium-priced exceptions:
- Times Square, NY (+1,123%)
- Union Square, NY (+683%)
- Hudson Square, NY (+493%)
- Le Droit Park, DC (+219%)
- West Village, NY (+170%)
- Vogel Park, Milwaukee, WI (+118%)
- Grant Park, Chicago, IL (+117%)
- Battery Park City, NY (+116%)
- Greenwich Village, NY (+110%)
- Forest Park, Baltimore, MD (+109%)
- Adair Park, Atlanta, GA (+104%)
- Washington Village, Baltimore, MD (+102%)
- Patterson Park, Baltimore, MD (+101%)
- Washington Square West, Philadelphia, PA (+85%)
- Rancho Park, Los Angeles, CA (+82%)
Times Square is the most extreme single named neighborhood in the study, with property crime running 1,123% above the NYC average and a $705k median home value placing it in the 69th percentile of the metro. Union Square ($1.26M, 97th percentile) and Hudson Square ($998k, 91st percentile) follow close behind. Together, these three Square neighborhoods help explain why Square is the only aspirational name in the study correlated with significantly higher crime overall. New York City alone contributes 6 entries to the list (3 Squares, 2 Villages, and 1 Park), Baltimore contributes 3 (2 Parks and 1 Village), and Atlanta, Chicago, DC, LA, Milwaukee, and Philadelphia each contribute 1. Vogel Park in Milwaukee stands out as the most extreme exception outside the East Coast, with property crime running 118% above its metro average.
The crimes driving these exceptions break down unevenly:
- Theft. Drives 10 of the 15 entries, including all 4 Square entries on the list.
- Home break-ins. Drive 4 entries: West Village, Adair Park, Washington Village, and Rancho Park.
- Vehicle break-ins. Drive 1 entry: Patterson Park in Baltimore.
Park is the most-represented name type on the list, appearing 8 times. That doesn't undercut Park's broader safety dividend, since Park-named neighborhoods average 18% less property crime than their metros overall. But it does highlight a quirk of the data: because Park is the most common aspirational name in the country, its sheer prevalence means many of the worst individual exceptions also carry the Park name. Square shows up 4 times (Times Square, Union Square, Hudson Square, and Washington Square West), and Village rounds out the list with 3 entries (West Village, Greenwich Village, and Washington Village). Greenwich Village ($1.10M median home value, 95th percentile of NYC) ranks as the most expensive entry on the list.
The single most striking exception may be Le Droit Park in Washington, DC, where the median home value of $783k sits at the 78th percentile of the metro but property crime runs 219% above the DC average. Theft alone runs 269% higher than the DC average. It's a clear case of the perception halo doing more work than the underlying numbers can support, especially under a Park name that usually does the opposite.
Looking past the name
Names are signals, not guarantees. The data shows that certain aspirational labels, including Lake, Heights, and Park, really do tend to track with safer property crime outcomes, often by significant margins. But the gap between the brochure and the streets can be wide, especially in premium-priced neighborhoods where the perception halo is doing a lot of work. For anyone weighing where to live, the name is one data point among many, and the local crime numbers are worth looking at directly.
Methodology
This study examines whether "aspirational" U.S. neighborhood names—Park, Village, Heights, Lake, Gardens, Ridge, Estates, Woods, Hills, Creek, Meadows, Glen, Manor, Forest, Pointe, Pines, Oaks, Grove, Square, and Crossing—actually correlate with safer property-crime outcomes, and whether that relationship holds across distinct types of crime that affect homeowners differently.
Approximately 1.90 million property-crime incidents were collected from each metro's open-data crime portal across 25 U.S. metropolitan areas: Chicago, New York, Los Angeles, Seattle, Washington DC, Philadelphia, Denver, Austin, Boston, San Francisco, Baltimore, Minneapolis, Pittsburgh, Cincinnati, Kansas City, Nashville, Atlanta, Dallas, Phoenix, Houston, Charlotte, Cleveland, Detroit, Milwaukee, and Buffalo. The time window covers January 1, 2023 through December 31, 2024. Each city's local crime taxonomy was mapped to three portable categories aligned with FBI UCR / NIBRS definitions: burglary (home break-ins), larceny (theft, including shoplifting, theft from buildings, and package theft as a single FBI category), and motor-vehicle theft (vehicle break-ins and stolen vehicles). Robbery, vandalism, and arson were excluded.
Each city's neighborhood boundaries were sourced from its own open-data portal where available—for example, Chicago's neighborhood boundaries, NYC's Neighborhood Tabulation Areas, and LA's Mapping LA layer. For Austin, Dallas, Kansas City, and Seattle, U.S. Census TIGER/Line block groups were used because no city-published name layer was available. For Phoenix, TIGER ZCTAs were used because the crime feed lacks latitude and longitude. Population and home-value figures come from the U.S. Census American Community Survey 5-Year Estimates 2018–2022, spatially weighted from block groups to neighborhood polygons using EPSG:5070 Albers Equal Area projection for accurate area calculations.
For each neighborhood, property crime was expressed as percent above or below the metro average, computed as (neighborhood_rate / metro_mean − 1) × 100. This places every neighborhood on a within-metro relative scale, controlling for absolute differences in crime levels between cities. Names were matched using whole-word, case-insensitive regular expression matches, ensuring that "Lakewood Heights" was classified as Heights rather than Lake, and that "Parkway Crossing" was not matched as Park. Neighborhoods with weighted population under 1,000 were excluded. Charlotte was excluded entirely from the descriptor analysis because its open-data boundary source—Mecklenburg County Subdivisions—consists of 4,597 residential-subdivision-level polygons averaging roughly 150 residents each, an order of magnitude finer than the neighborhood-level polygons used by other metros. After excluding Charlotte, the descriptor analysis covers approximately 1.88 million incidents across 18 metros with city-published name-bearing neighborhood polygons.
Per-descriptor differences from the metro average were tested for statistical significance with one-sample, two-sided t-tests using SciPy's ttest_1samp; a finding is reported as robust only when both p<0.05 and N≥5 neighborhoods. The asset-level matrix is restricted to descriptors with at least 10 neighborhoods to ensure stable estimates for visual presentation.
The 15 most extreme exceptions on the "Beyond the Name" list were drawn from the subset of named neighborhoods that meet two conditions: a home value above their metro's median, AND a property-crime rate above the metro mean. The dominant crime-type driver for each entry was identified as the sub-category with the largest positive delta versus the metro average. Three entries on the ranked list represent multi-neighborhood boundaries as defined by their source data: "Le Droit Park" covers the Howard University / Le Droit Park / Cardozo-Shaw polygon in DC's open-data Neighborhood Clusters layer; "Battery Park City" covers the Financial District–Battery Park City polygon in NYC's NTA layer; and "Washington Village" covers the Washington Village/Pigtown polygon in Baltimore's City Neighborhoods layer.
This study measures association, not causation, and does not control for income, density, or housing-tenure confounds. Crime-reporting bias may be present, as more affluent areas tend to report property crime at higher rates due to insurance-claim incentives; the "Beyond the Name" finding flips this confound in the study's favor by demonstrating crime above metro average even in higher-income areas.
Fair use statement
We invite you to share the insights from this article for noncommercial purposes. If you do, please include a link back to this page to ensure proper attribution to Vivint and access to the full findings.
Get a free quote today.
A Vivint Smart Home Pro will contact you within 24 hours. Or skip the form and call now: 844.481.8630.
Everything works together
Combine products
for a safer home
You may also like:
Security Cameras
All About Vivint Smart Deter™
Home Security
The New-Build Blind Spot: Are Newer Homes Actually Safer From Break-Ins?
New homes tend to see fewer burglaries, but not always. See how housing age stacks up against break-in rates across 177 U.S. cities.

Smart Home
EV Charger Theft Is Surging: This Smart Home Setup Stops It
EV charger thefts more than doubled in 2024. Here's the four-attack-vector smart home setup that stops cable, head, and unit theft cold.
Jun. 26, 2026
Related content
-
What You Need to Know About Crime in Louisiana
If you want to stay safe, you need to understand what crime in Louisiana is like. Our guide reveals everything you need to know about state crime rates.
-
Living in Ohio: The Safest Places
Discover the safest cities and neighborhoods in Ohio, including family-friendly destinations close by natural attractions like Lake Erie and great parks.
-
Which US Cities Have the Most Overnight Break-Ins?
New data reveals overnight burglary trends and the nighttime habits helping Americans stay secure.