The Outdoor Camera Pro 3 takes smart features and functionality to the next level with powerful upgrades that protect your home and vehicle more accurately than ever.
Safest Summer Travel Destinations in the US
Summer travel season brings packed schedules, full hotels, and a steady churn of people moving through America's most popular destinations. But not every vacation hotspot carries the same property crime risk for visitors, and some cities see noticeable spikes during peak travel months. To help travelers plan smarter, Vivint analyzed FBI data to identify which summer destinations expose vacationers to the most property crime risk and which deliver the safest getaways.
The analysis ranked 25 popular travel cities using FBI National Incident-Based Reporting System (NIBRS) data filtered to June, July, and August 2024. Each city received a composite score based on burglary, larceny, and motor vehicle theft rates per 100,000 residents during those months, along with a separate look at how those rates have changed since 2022.

Key takeaways
- Park City, UT, has the lowest summer property crime rate at 136, followed by San Diego, CA (139) and Santa Barbara, CA (139).
- Honolulu, HI, has the highest summer property crime rate among popular U.S. travel destinations, followed by Seattle, WA, and Philadelphia, PA.
- Miami, FL, has seen the largest increase in summer property crime since 2022 (+60%), followed by Nashville, TN (+22%) and Juneau, AK (+18%).
- West Palm Beach, FL (-34%) and San Francisco, CA (-31%) have seen the largest decreases in summer property crime since 2022.
- Kansas City, MO, has the highest summer motor vehicle theft rate of any popular travel destination (565 per 100,000 residents), and Seattle, WA, has the highest summer burglary rate (291 per 100,000 residents).
- Juneau, AK, sees the biggest summer crime spike of any popular destination, with property crime running 30% higher during peak summer than the rest of the year, followed by Kansas City (+28%) and Anchorage (+21%).
- Burglary nationally runs 4.7% higher during June through August than the rest of the year.
The vacation risk index
Vacation property crime varies widely from city to city, even among destinations of similar size and popularity. The cities below are ranked by their composite summer property crime rate, which combines burglary, larceny, and motor vehicle theft incidents per 100,000 residents.
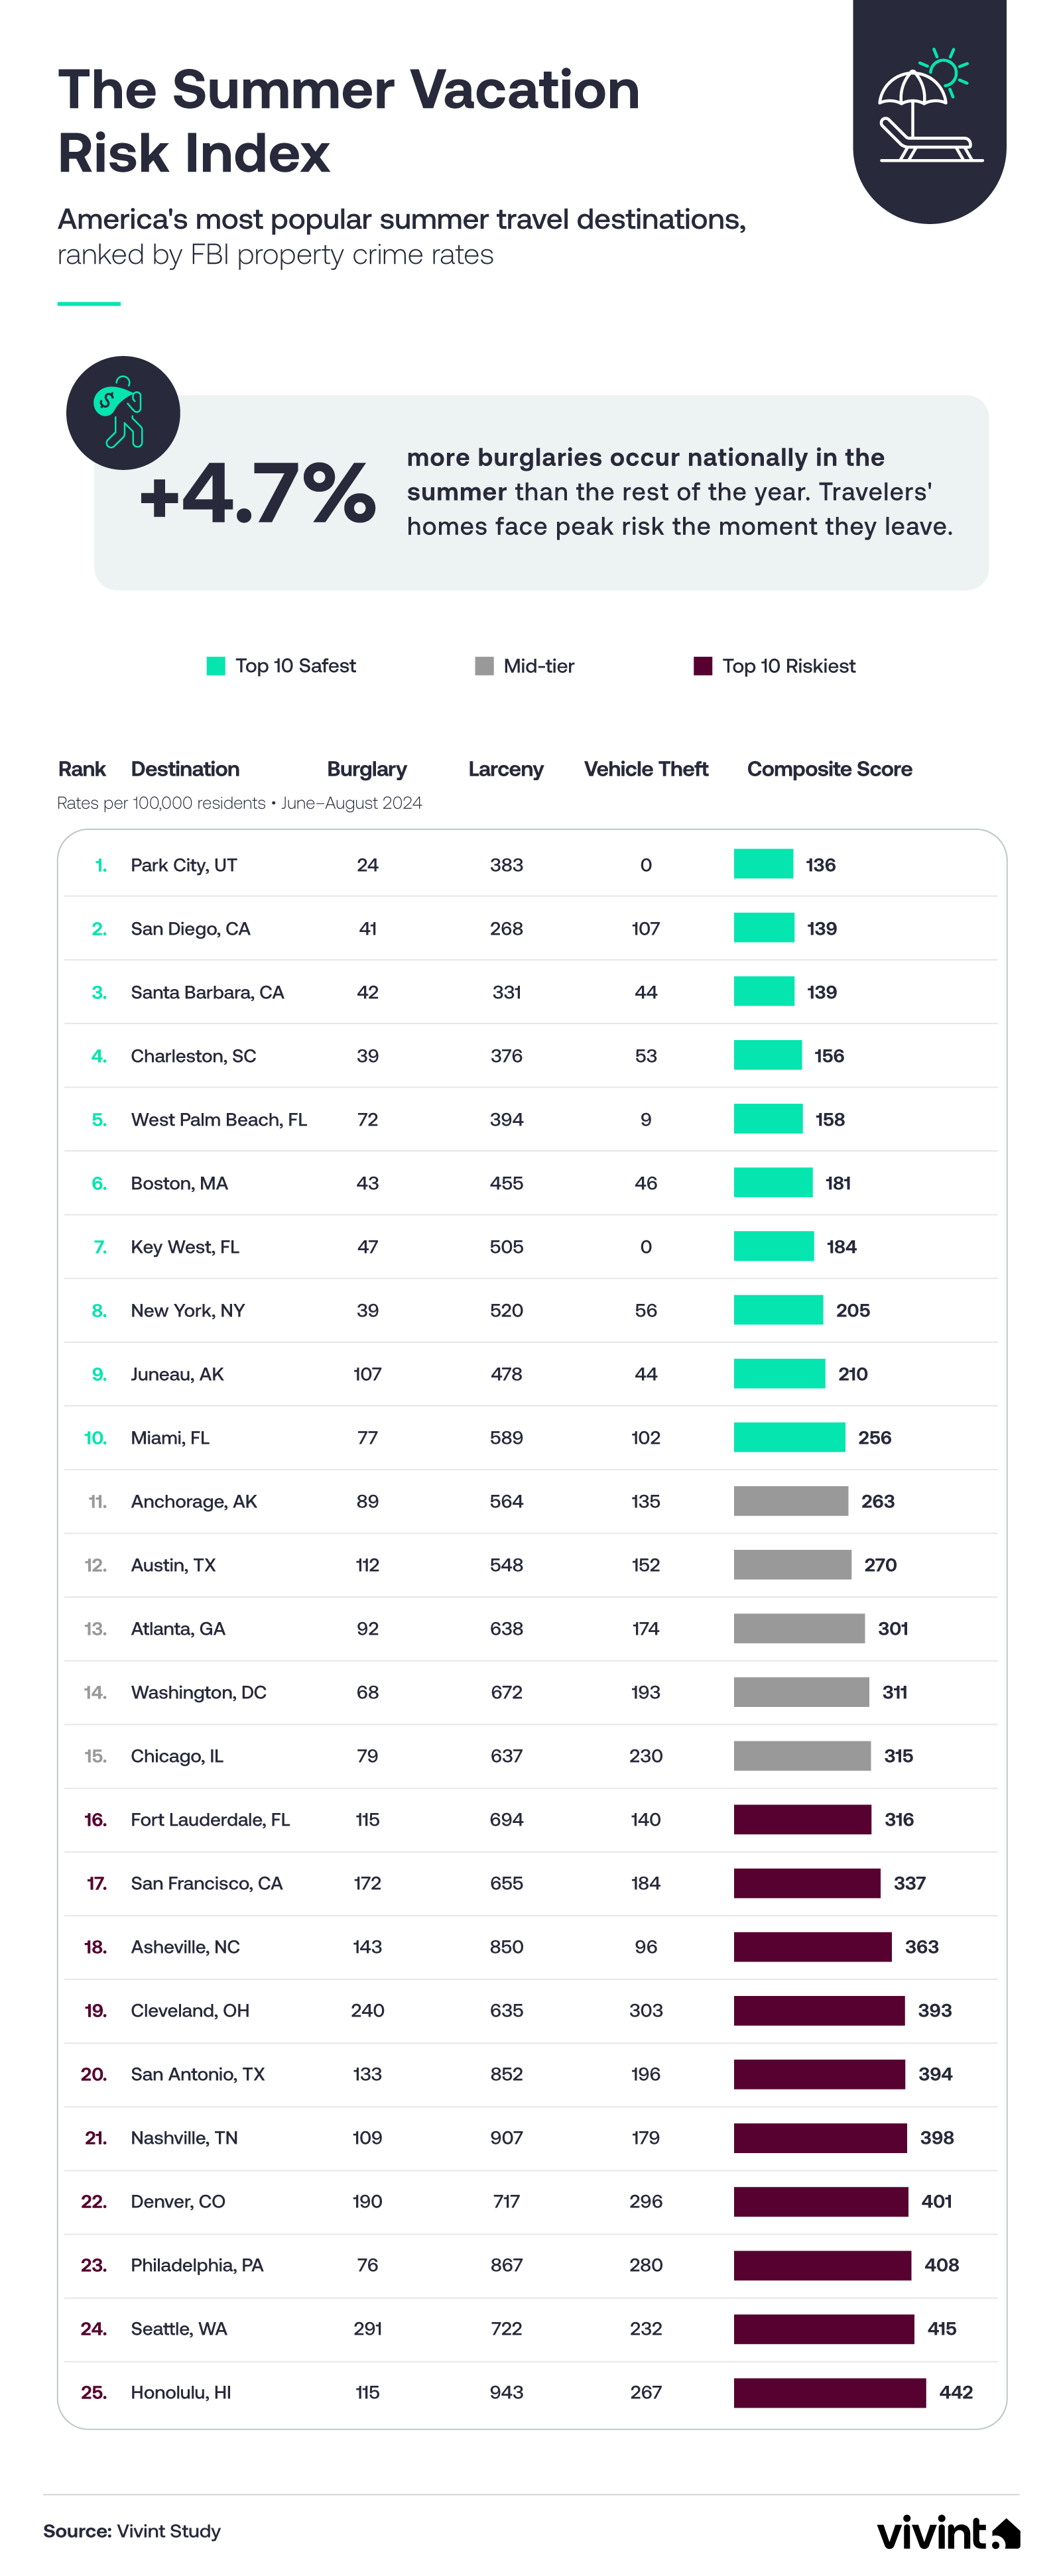
Park City, Utah, ranked safest overall with a composite property crime rate of just 136 per 100,000 residents during peak travel months. On the other end of the rankings, Honolulu, Hawaii, posted the highest rate at 442, more than three times Park City's. This marks the largest gap between any safest and riskiest destination on the index.
The 6 safest summer travel destinations:
- Park City, UT (136)
- San Diego, CA (139)
- Santa Barbara, CA (139)
- Charleston, SC (156)
- West Palm Beach, FL (158)
- Boston, MA (181)
The 6 riskiest summer travel destinations:
- Honolulu, HI (442)
- Seattle, WA (415)
- Philadelphia, PA (408)
- Denver, CO (401)
- Nashville, TN (398)
- San Antonio, TX (394)
The breakdown by crime type tells more of the story:
- Burglary. Seattle leads in summer burglary at 291 per 100,000 residents, followed by Cleveland, OH (240) and Denver, CO (190).
- Larceny. Honolulu tops larceny at 943, followed by Nashville, TN (907) and Philadelphia, PA (867).
- Motor vehicle theft. Cleveland has the highest summer motor vehicle theft rate at 303 per 100,000 residents, followed by Denver (296) and Philadelphia (280).
The summer concentration shows up at the national level, too. Burglary nationally runs 4.7% higher during June through August than the rest of the year, averaging 66,035 monthly incidents during summer months compared to 63,078 the rest of the year. Empty homes during travel season may help explain part of the increase.
Where summer property crime is rising and falling
Beyond a single year's snapshot, summer property crime patterns shift meaningfully over time. Some destinations have seen substantial increases since 2022, while others have moved in the opposite direction.
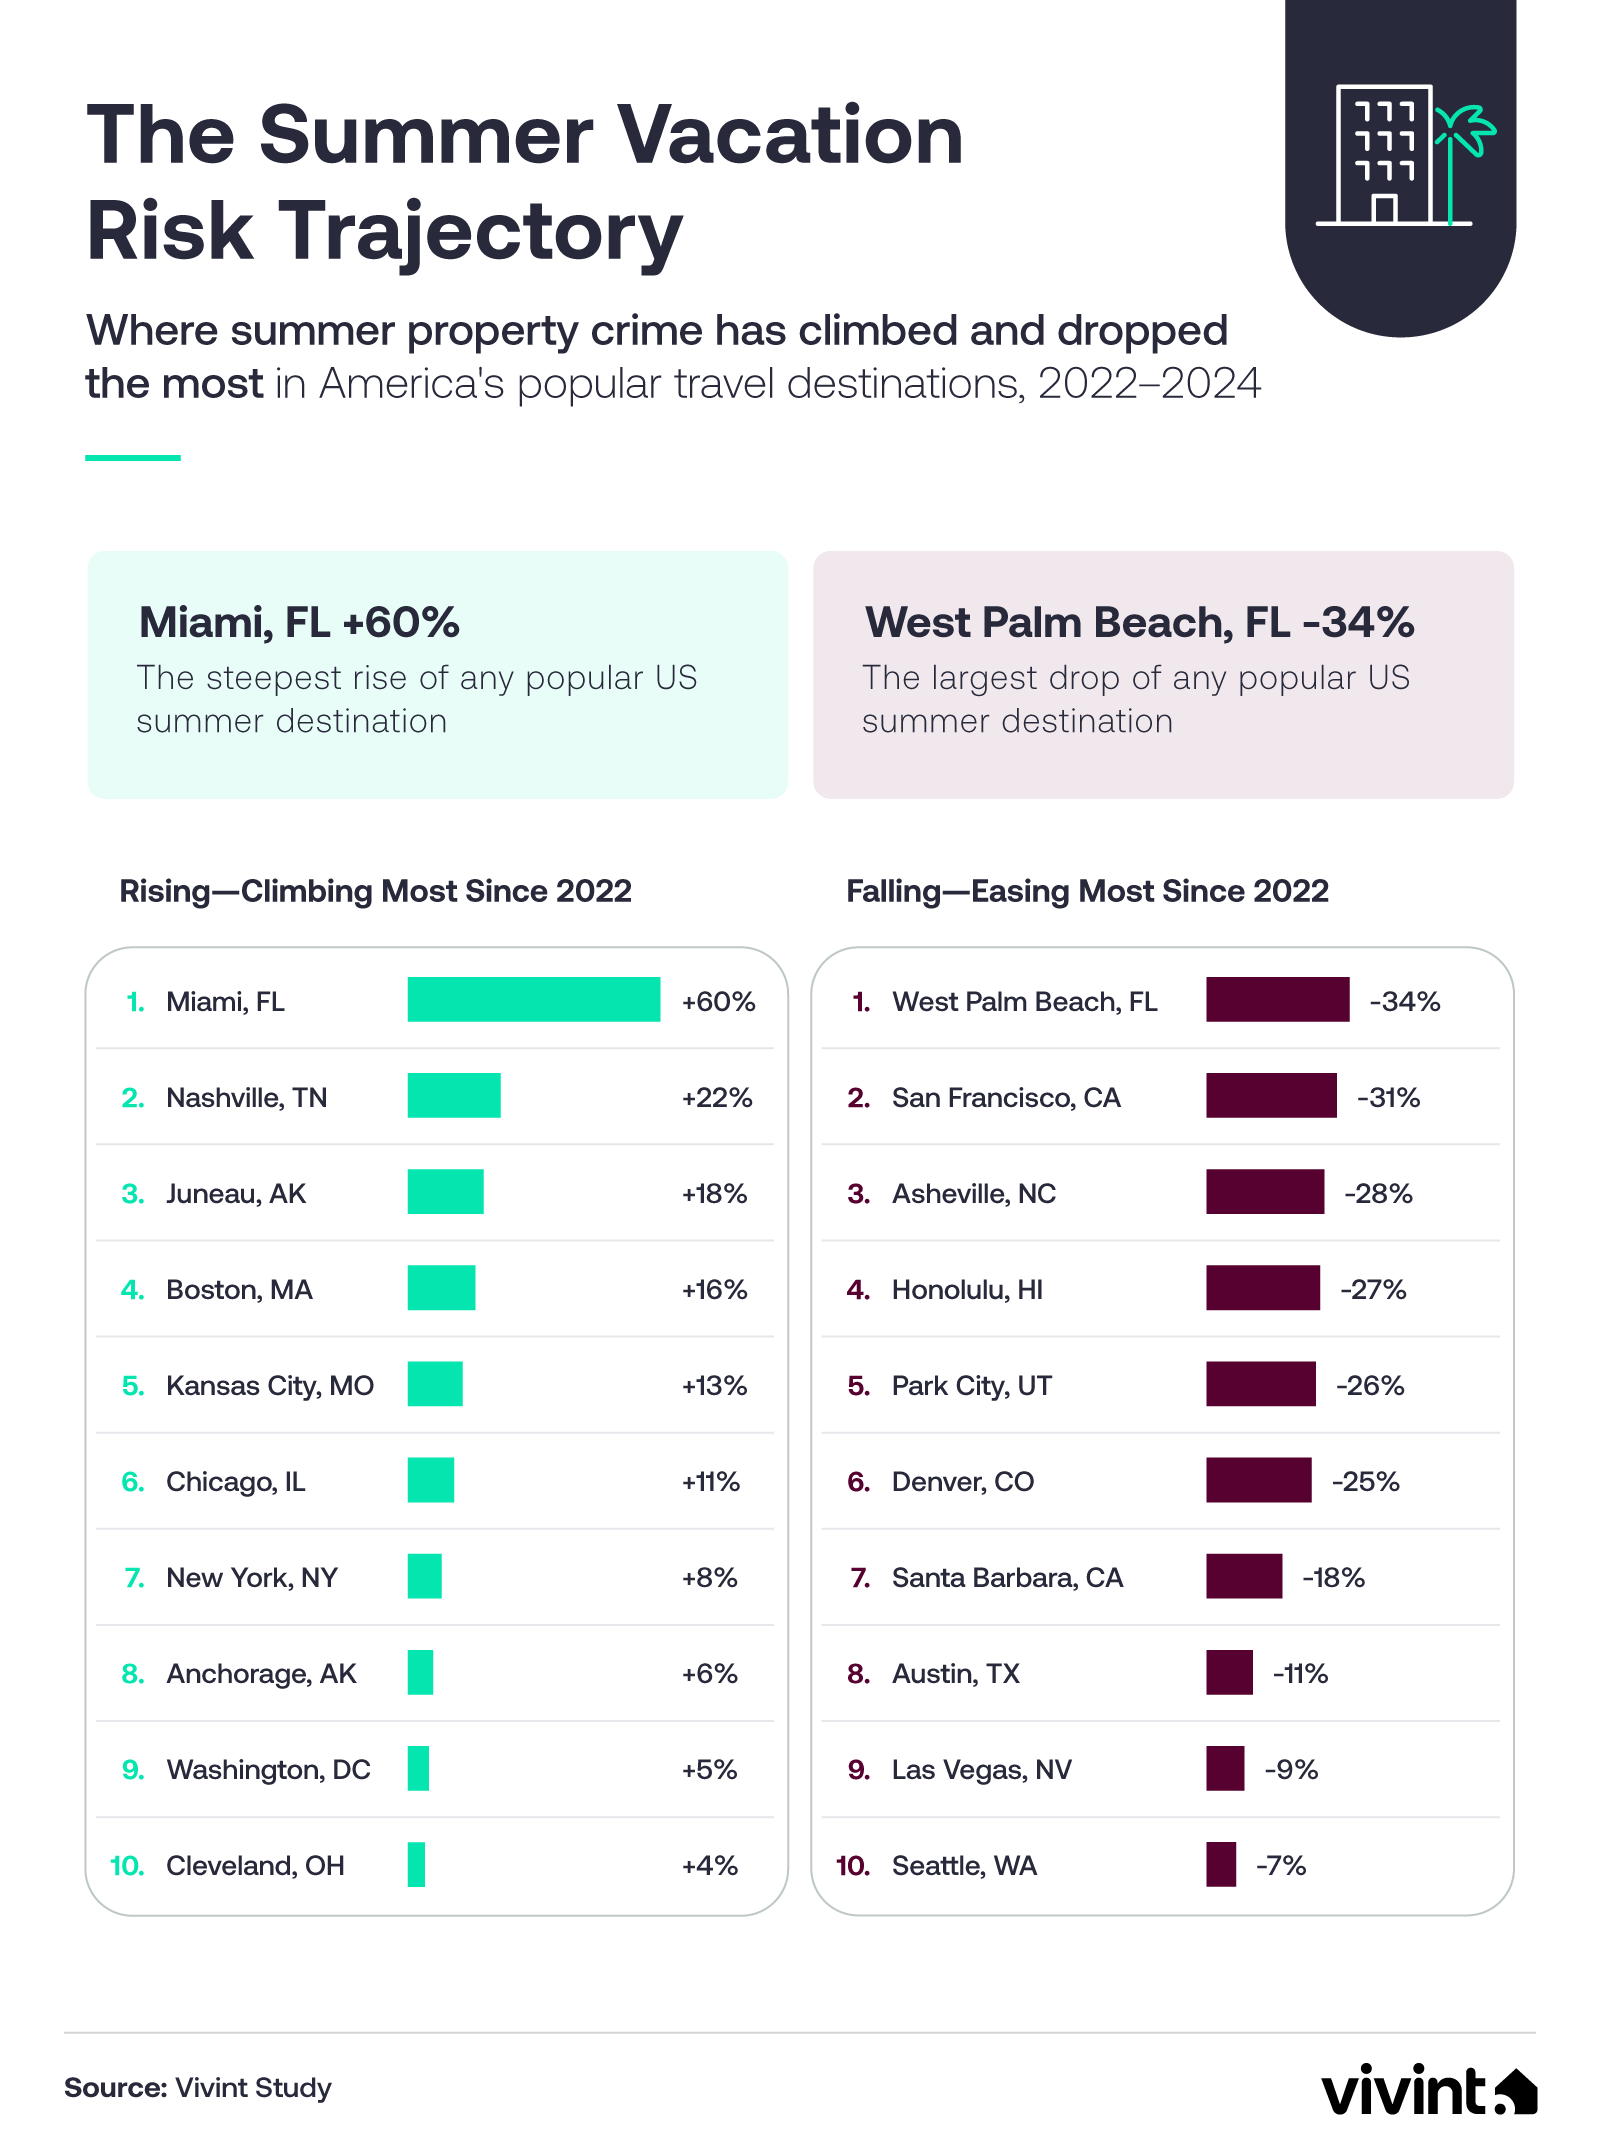
Miami, Florida, recorded the largest jump in summer property crime since 2022, climbing 60%. On the opposite end, West Palm Beach, Florida, fell 34% over the same period, the largest drop in the analysis.
Destinations with the largest summer property crime increases since 2022:
- Miami, FL (+60%)
- Nashville, TN (+22%)
- Juneau, AK (+18%)
- Boston, MA (+16%)
- Kansas City, MO (+13%)
- Chicago, IL (+11%)
- New York, NY (+8%)
- Anchorage, AK (+6%)
- Washington, DC (+5%)
- Cleveland, OH (+4%)
Destinations with the largest summer property crime decreases since 2022:
- West Palm Beach, FL (-34%)
- San Francisco, CA (-31%)
- Asheville, NC (-28%)
- Honolulu, HI (-27%)
- Park City, UT (-26%)
- Denver, CO (-25%)
- Santa Barbara, CA (-18%)
- Austin, TX (-11%)
- Las Vegas, NV (-9%)
State-level patterns offer additional context. Florida's popular destinations split sharply: Miami climbed 60% while West Palm Beach dropped 34%. California's destinations all moved in the same direction, with San Francisco (-31%), Santa Barbara (-18%), and San Diego (-1%) each posting declines. Two Alaska cruise ports landed on the rising list, with Juneau up 18% and Anchorage up 6%.
Juneau's pattern is notable for another reason. Its summer property crime rate runs 30% higher than the rest of the year, the largest seasonal gap of any destination analyzed. Kansas City sits at +28%, with Anchorage at +21%. For travelers, this means some popular destinations see particularly concentrated risk during peak travel months, even when their overall annual rates look average.
Planning a safer summer trip
Property crime patterns vary widely across America's top summer destinations, and those gaps tend to widen during peak travel months. For vacationers, that's worth keeping in mind when planning a trip. Locking up your vacation rental and keeping tabs on your home while you're away are small habits that pay off across the whole trip.
Methodology
This study analyzes FBI-reported summer property crime rates (per 100,000 residents) for popular U.S. summer travel destinations. Crime data was drawn from the FBI's National Incident-Based Reporting System (NIBRS) via the Crime Data Explorer, and population data from the U.S. Census Bureau's American Community Survey 1-Year 2024 estimates, with 5-Year fallback for cities below the 1-Year sample threshold. The destination list combines TripAdvisor's 2025 Travelers' Choice US rankings (Popular and Trending), U.S. News & World Report's 2026 Best U.S. Cities to Visit and Best Places to Visit in the USA rankings, and AAA's 2025 Top 10 July 4th Domestic destinations, deduplicated to 33 unique cities. Only cities with complete and reliable NIBRS reporting were included in the final rankings.
To rank destinations by summer property crime, monthly counts of burglary, larceny-theft, and motor vehicle theft were summed for each city across June, July, and August 2024—the most recent complete year of NIBRS data. Each offense total was normalized to a rate per 100,000 residents using 2024 population estimates. The composite vacation risk score is the equal-weighted arithmetic mean of these three per-100,000 rates. Lower composite scores indicate safer destinations; higher scores indicate riskier ones.
To measure change over time, the same composite was calculated for summer 2022 and summer 2024 for each city. The percentage change was then calculated by comparing the 2022 composite to the 2024 composite. Summer 2022 was used as the baseline because the FBI's full NIBRS transition occurred during 2021, and several agencies filed 2021 records with substantively undercounted incidents during the transition. Summer 2022 represents the first full year of post-transition NIBRS-only reporting.
To examine the seasonal risk picture, monthly property crime rates per 100,000 residents were calculated for all twelve months of 2024. For each city, the average monthly composite rate during the summer (June–August) was compared to the average monthly composite rate during the rest of the year (September–May). The percentage difference between these two averages measures how much higher or lower property crime runs during peak travel months for each destination.
The national seasonality benchmark compares average monthly burglary incidents nationally during June–August to September–May for 2024, drawn from the FBI Crime Data Explorer's national summarized endpoint.
Fair use statement
We invite you to share the insights from this article for noncommercial purposes. If you do, please include a link back to this page to ensure proper attribution to Vivint and access to the full findings.
Get a free quote today.
A Vivint Smart Home Pro will contact you within 24 hours. Or skip the form and call now: 844.481.8630.
Everything works together
Combine products
for a safer home
You may also like:
Security Cameras
Vivint Outdoor Camera Pro: Meet the Smartest Outdoor Camera on the Market
Feb. 04, 2026

Smart Guides
The Vivint Buying Guide: What's Included, Average Cost, and How to Buy
Interested in a Vivint Smart Home system but still have some questions? We've got answers for the most frequently asked questions about our security systems.
Nov. 07, 2019

Home & Family
10 Things You Probably Didn’t Know About Vivint
Vivint Smart Home is the number one smart home service provider in North America, and enhances the lives of children with intellectual disabilities through Vivint Gives Back.
Feb. 02, 2018
Related content
-
Best Smart Home Security Systems
Protect Your Home with Vivint's Home Security Systems & Burglar Alarm - Call 855.677.2644 for More Information about our Award Winning 24 7 Home Security Services.
-
Security Camera Systems
Vivint's Home Security Cameras System allows you to keep an eye on your home via Indoor Security Camera & Outdoor Security Cameras all Accessible through Vivint’s App. Call 855-743-7375 to ...
-
Home Automation Services for Smarter Living
Control Security Equipment & Smart Home Devices with a Vivint Home Automation System. Call 855.747.4838 for More Information about our Award Winning 24/7 Smart Home Automation Systems.